The Wonder of Science
The Wonder of Science: Ms Ls2 1: Effects of Resource Availability
Work samples, phenomena, assessment templates, and videos that directly address standard MS-LS2-1: effects of resource availability.
National Council of Teachers of Mathematics
The Math Forum: Probability and Statistics
This page is a math home page that includes information on all topics of probability and statistics.
University of Georgia
University of Georgia: Definitions in Statistics
This site contains definitions to use in statistics and ways to collect data.
Khan Academy
Khan Academy: Interpreting a Confidence Interval for a Mean
After we build a confidence interval for a mean, it's important to be able to interpret what the interval tells us about the population and what it doesn't tell us.
Khan Academy
Khan Academy: Interpreting a Z Interval for a Proportion
Once we build a confidence interval for a proportion, it's important to be able to interpret what the interval tells us about the population, and what it doesn't tell us. Let's look at few examples that demonstrate how to interpret a...
Science Education Resource Center at Carleton College
Serc: Investigating the Long Meadow Lake Unit of Valley Nat'l Wildlife Refuge
This is a field investigation at the Bass Ponds Trailhead area in the MN Valley National Wildlife Refuge in which middle schoolers will collect data in the field and samples to test back in the classroom. Students will try to elicit the...
Louisiana Department of Education
Louisiana Doe: Louisiana Believes: Grade 8 Social Studies Units
A grade 8 scope and sequence document with six complete units.
Curated OER
Ny Times: Testing Well Known Product Names Lesson Plan
In this lesson, students learn about the advent of neuromarketing as a means to assess the effects of certain brands on the brain activity of prospective buyers. They then design their own experiments that test the power of certain...
Texas Instruments
Texas Instruments: Numb3 Rs: Different or Not?
Based off of the hit television show NUMB3RS, this lesson has students examine cancer rates in population samples of the New England states to determine if the states' cancer rates are statistically similar. Hypothesis testing is...
Texas Instruments
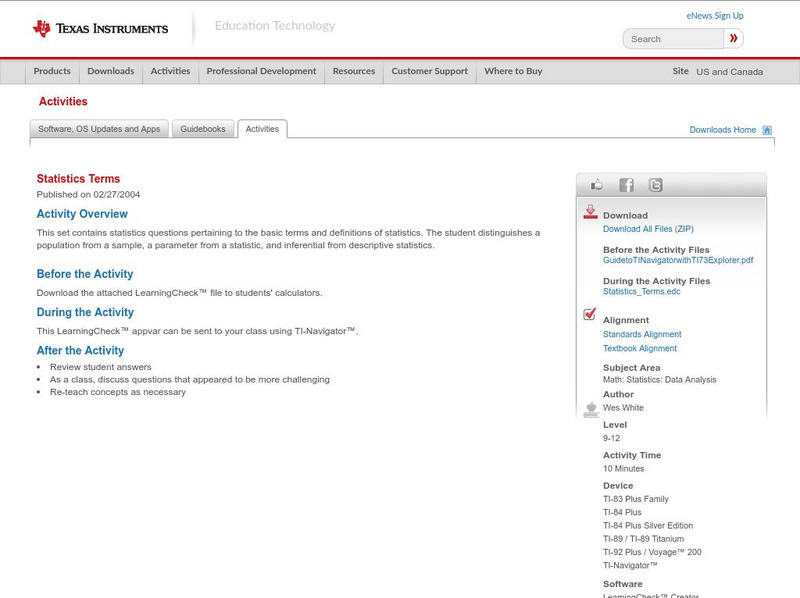
Texas Instruments: Statistics Terms
This set contains statistics questions pertaining to the basic terms and definitions of statistics. The student distinguishes a population from a sample, a parameter from a statistic, and inferential from descriptive statistics.
Texas Instruments
Texas Instruments: Central Limit Theorem
This set contains questions regarding the Central Limit Theorem. The student sees that, as the size n increases, the shape of the sampling distribution gradually approaches a normal curve, and its population standard deviation decreases.
Alabama Learning Exchange
Alex: My Peanut Butter Is Better Than Yours!
The students will engage in the process of statistical data comparing data using tables and scatterplots. The students will compare data using measures of center (mean and median) and measures of spread (range). This lesson can be done...
Vision Learning
Visionlearning: Statistics: Introduction to Inferential Statistics
An introduction to inferential statistics to find relationships and patterns in datasets.
Calculator Soup
Calculator Soup: Statistics Calculator
Calculate basic summary statistics for a sample or population data set including minimum, maximum, range, sum, count, mean, median, mode, standard deviation and variance.
Education Place
Houghton Mifflin: Eduplace: Math Steps: What Is It? Data
This is a great place for lesson information on the concept of analyzing data - measures of central tendency. Three other tabs are available besides the "What Is It?" link. Tips and Tricks, When Students Ask, and Lesson Ideas also...
Curated OER
Steps Statistics Glossary
Go to this site for a brief definition for what the target population of a sample is along with an example problem.
Khan Academy
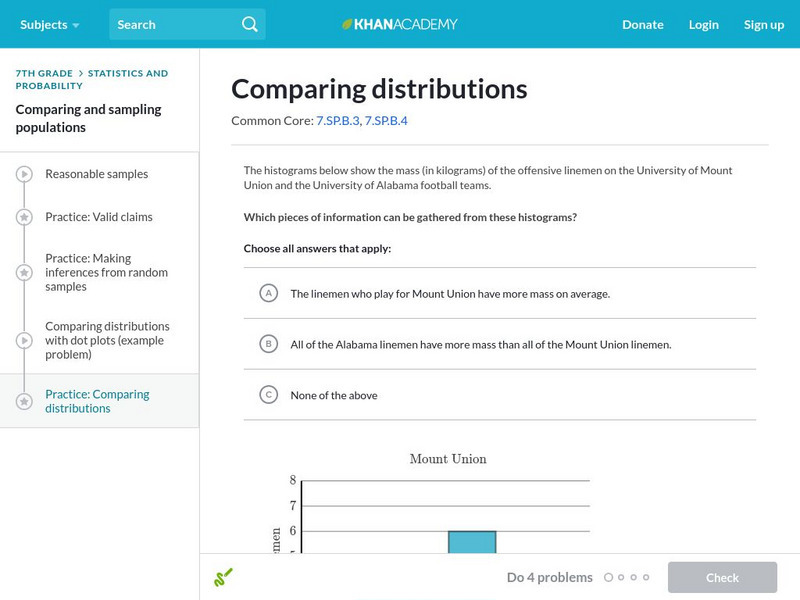
Khan Academy: Comparing Distributions
Practice comparing distributions of data in different forms of graphical representation.
Khan Academy
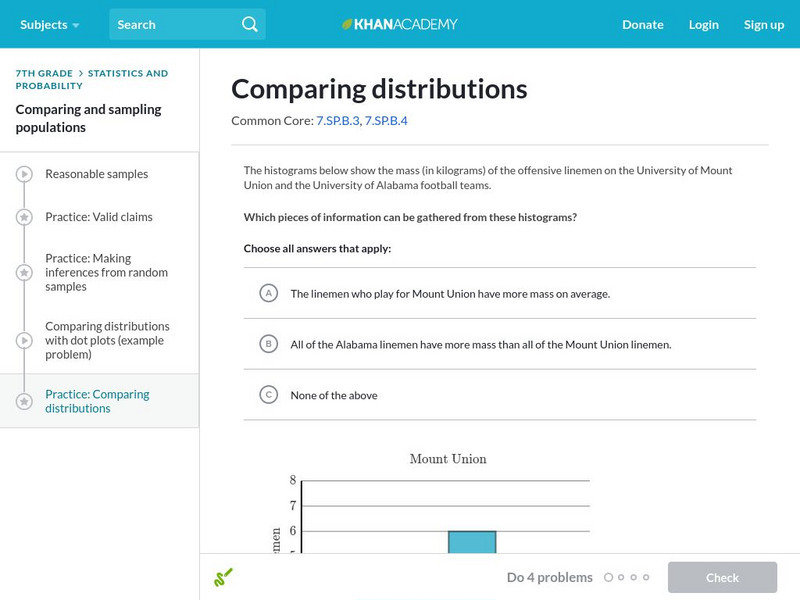
Khan Academy: Comparing Distributions
Try these practice problems comparing distributions.
Other popular searches
- Random Sampling Population
- Population Sampling
- Population Sampling Quadrat
- Population Sampling Qua Drat
- Population Sampling Quiz
- Bat Population Sampling
- Natural Population Sampling
- Population Sampling Marine
- Science Sampling Population


