PBS
Pbs Mathline: Mystery Liquids Lesson Plan [Pdf]
Students gather data from two mystery liquids to explore linear functions. Printable lesson.
TeachEngineering
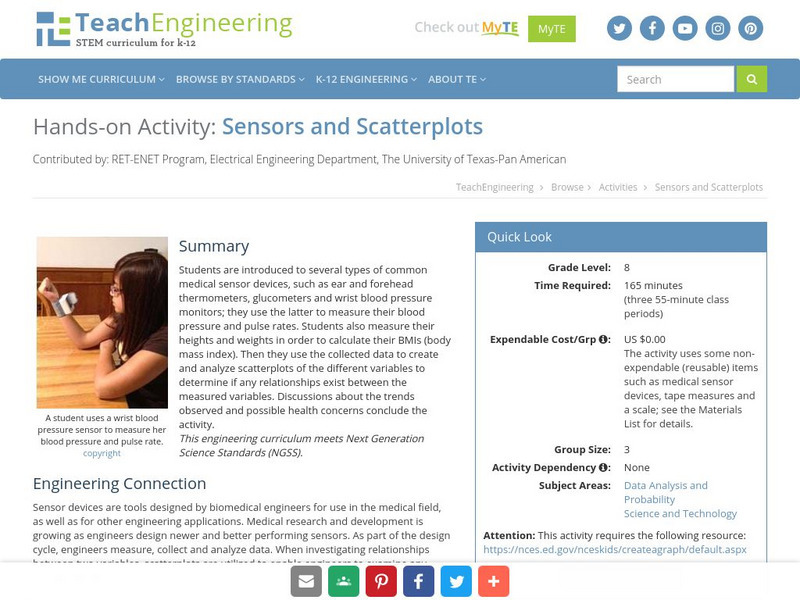
Teach Engineering: Sensors and Scatterplots
Students explore the use of several biomedical engineering sensor devices, and then use the collected data to create and analyze scatterplots of the different variables to determine if any relationships exist between the measured...
Texas Education Agency
Texas Gateway: Collecting Data and Making Predictions
Given an experimental situation, the student will write linear functions that provide a reasonable fit to data to estimate the solutions and make predictions.
Texas Instruments
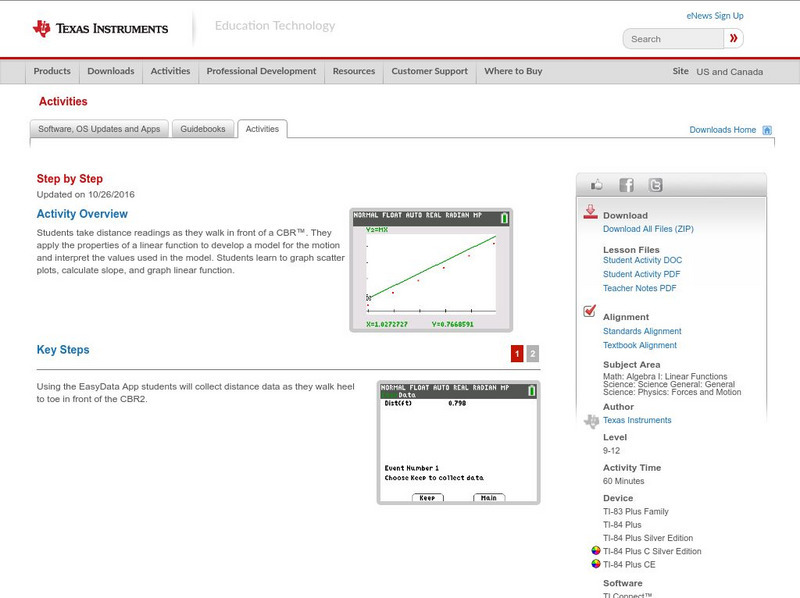
Texas Instruments: Step by Step
In this activity, students take distance readings as they walk in front of a CBR. They apply the properties of a linear function to develop a model for the motion and interpret the values used in the model. Students learn to graph...
Texas Instruments
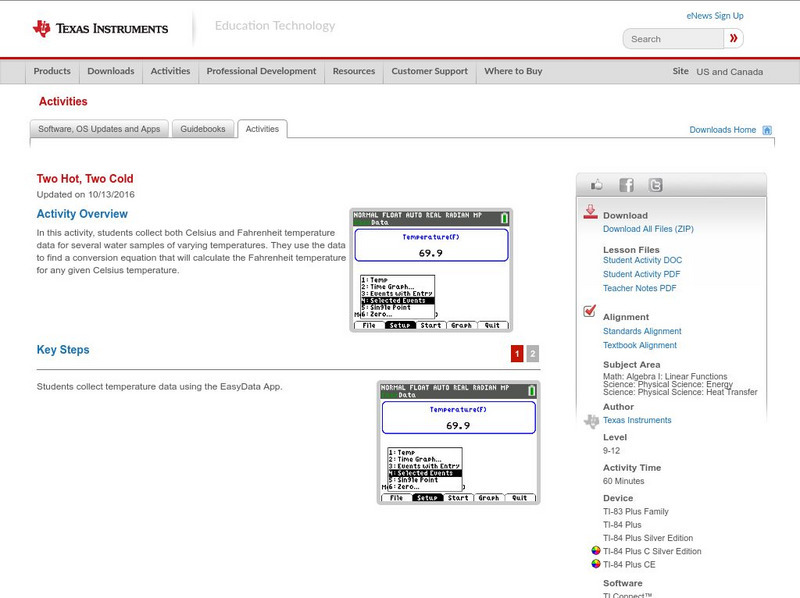
Texas Instruments: Two Hot, Two Cold
In this activity, students collect both Celsius and Fahrenheit temperature data for several water samples of varying temperatures. They use the data to find a conversion equation that will calculate the Fahrenheit temperature for any...
Texas Instruments
Texas Instruments: The Normal Distribution
Students graph normal distributions, shade desired areas, and find related probabilities. They graph Normal probability scatter plots to check the normal (linear) shape of a data distribution.
Texas Instruments
Texas Instruments: Numb3 Rs: Exponential Modeling
Based off of the hit television show NUMB3RS, this lesson introduces students to exponential equations, their graphs, and their application in the real world. The lesson is framed in the context of the number of cell phone users for a...
Texas Instruments
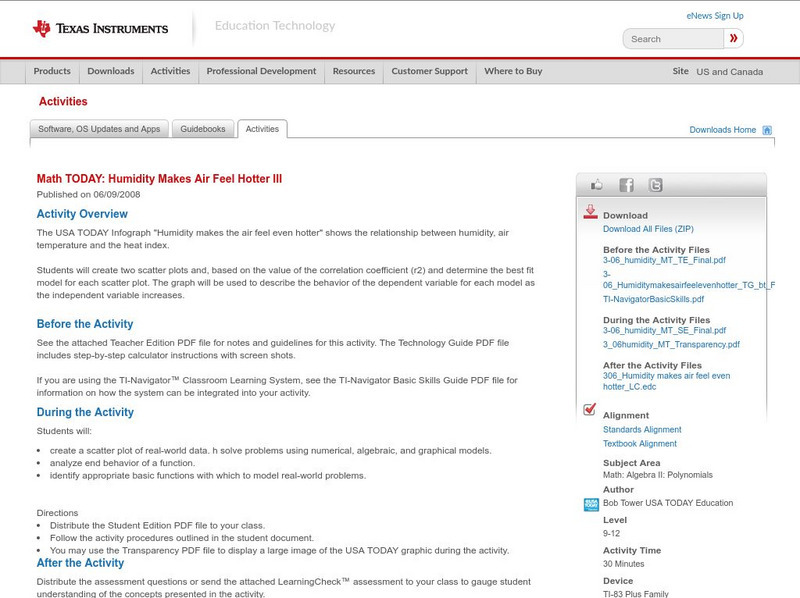
Texas Instruments: Math Today: Humidity Makes Air Feel Hotter Iii
Investigate the relationship among humidity, air temperature, and the heat index while learning about modeling data, evaluating functions, and describing the end behavior of a function. Students will use graphing calculator technology to...
Purple Math
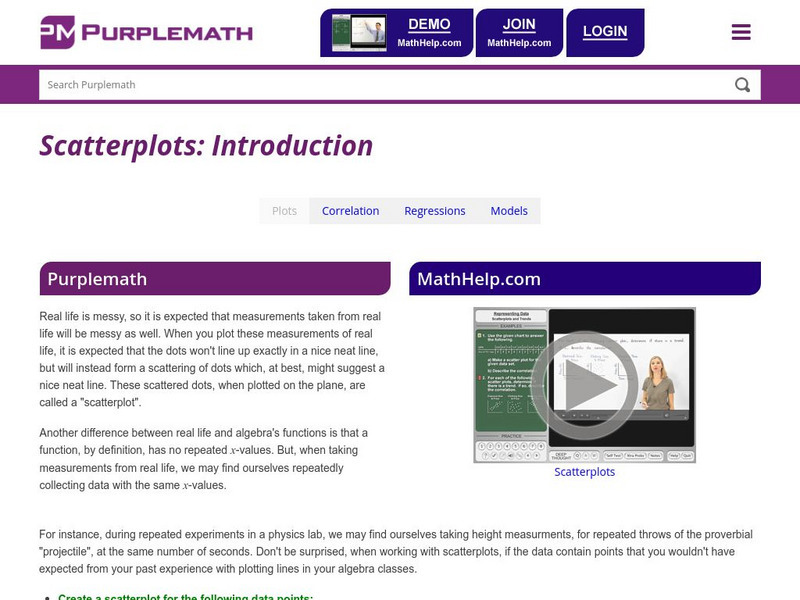
Purplemath: Scatterplots and Regressions
Explains the purpose of scatterplots, and demonstrates how to draw them.
Other
Stat Soft: Statistics Glossary
Dozens of statistical terms are defined and illustrated in this glossary.
Rice University
Hyper Stat Online Statistics Textbook: Chapter 3: Describing Bivariate Data
This chapter of an online textbook begins with a description of scatterplots, then focuses on the Pearson Product Moment Correlation.
Alabama Learning Exchange
Alex: Ballistic Statistics!
Students will collect examples of various statistical instruments and form an electronic scrapbook. These materials will be gathered from electronic sources in addition to periodicals and other print resources.
Alabama Learning Exchange
Alex: Statistically Thinking
The object of this project is for students to learn how to find univariate and bivariate statistics for sets of data. Also, the students will be able to determine if two sets of data are linearly correlated and to what degree. The...


![Pbs Mathline: Mystery Liquids Lesson Plan [Pdf] Lesson Plan Pbs Mathline: Mystery Liquids Lesson Plan [Pdf] Lesson Plan](https://d15y2dacu3jp90.cloudfront.net/images/attachment_defaults/resource/large/FPO-knovation.png)
