Charleston School District
Analyzing Scatter Plots
Scatter plots tell a story about the data — you just need to be able to read it! Building from the previous lesson in the series where learners created scatter plots, they now learn how to find associations in those scatter plots. They...
Curated OER
Birds' Eggs
More than just data, scatter plots are full of information that can be used to answer a variety of questions. This lesson uses a plot with information about bird egg sizes to answer questions about the relationship between length and...
Charleston School District
Constructing Scatter Plots
Having more letters in your name helps you get a better grade in your math class—or does it? Learners create scatter plots to organize data. The lesson places emphasis on determining scale and intervals and labeling axis.
Willow Tree
Scatterplots and Stem-and-Leaf Plots
Is there a correlation between the number of cats you own and your age? Use a scatter plot to analyze these correlation questions. Learners plot data and look for positive, negative, or no correlation, then create stem-and-leaf plots to...
Charleston School District
Pre-Test Unit 9: Scatter Plots
What do your classes know about statistics? Use a pre-test to determine their background. Topics include scatter plots and lines of best fit, two-way frequency tables, and modeling with linear equations.
Jordan-Granite Consortium
Scatter Diagram
You aced the first test, so your score on the second one shouldn't matter, right? Young pupils first draw a best fit line on a provided scatter plot showing test scores for two different tests. They then evaluate five statements on the...
EngageNY
Relationships Between Two Numerical Variables
Is there another way to view whether the data is linear or not? Class members work alone and in pairs to create scatter plots in order to determine whether there is a linear pattern or not. The exit ticket provides a quick way to...
Curated OER
Scatter Plots
In this Algebra I/Geometry/Algebra II worksheet, young scholars create a scatter plot and analyze the data to determine if the data show any type of correlation. The four page worksheet provides extensive explanation of topic,...
Curated OER
Scatter Plots
In this statistics worksheet, 11th graders analyze different scatter plot graphs for positive, negative and no correlation. They graph their data and analyze it using scatter plots.There is 1 question with an answer key.
Curated OER
Lesson 6-7: Scatter Plots and Equations of Lines
For this scatter plot worksheet, students examine tables and write a linear equation that matches the table. Students graph linear equations. They read scatter plots, determine the trend line, and write a linear equation to match...
Curated OER
Scatterplot
In this scatterplot worksheet, 9th graders solve and complete 7 different problems that include defining various scatterplots. First, they use the data plotted on the scatterplot that represent the best prediction. Then, students use the...
Raytheon
Scatter Plots
In this scatter plots worksheet, students complete multiple choice questions about scatter plots having to do with money, free throws, exercising, and more. Students complete 8 problems.
Texas Instruments
Finding Linear Models Part III
Explore linear functions! In this Algebra I lesson, mathematicians graph data in a scatter plot and use a graphing calculator to find a linear regression and/or a median-median line. They use the model to make predictions.
Inside Mathematics
Scatter Diagram
It is positive that how one performs on the first test relates to their performance on the second test. The three-question assessment has class members read and analyze a scatter plot of test scores. They must determine whether...
Curated OER
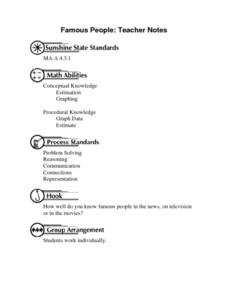
Famous People: Teacher Notes
Young statisticians practice creating scatter plots. First, they estimate the age of 14 people. Next, they write down the estimate in a table labeled x. Then write down their actual age in the table labeled y. Using these x and y...
EngageNY
Analyzing Residuals (Part 1)
Just how far off is the least squares line? Using a graphing calculator, individuals or pairs create residual plots in order to determine how well a best fit line models data. Three examples walk through the calculator procedure of...
Mathed Up!
Scatter Graphs
Make an estimate by getting in line. The class works with scatter plots and lines of best fit to make an estimate for given values. Pupils determine whether there is a positive or negative correlation and draw a best-fit line. Using the...
Charleston School District
The Line of Best Fit
If it's warm, they will come! Learners find a line of best fit to show a relationship between temperature and beach visitors. Previous lessons in the series showed pupils how to create and find associations in scatter plots. Now, they...
Inside Mathematics
Population
Population density, it is not all that it is plotted to be. Pupils analyze a scatter plot of population versus area for some of the states in the US. The class members respond to eight questions about the graph, specific points and...
EngageNY
Relationships Between Two Numerical Variables
Working in small groups and in pairs, classmates build an understanding of what types of relationships can be used to model individual scatter plots. The nonlinear scatter plots in this lesson on relationships between two numerical...
Virginia Department of Education
Scatterplots
Math is all fun and games with this activity! Learners use an activity designed around hula hoops to collect data. They create scatter plots with their data and then analyze the graphs for correlation.
Curated OER
Scatter Plots
In this scatter plots worksheet, students solve and complete 4 different problems. First, they use the table shown to model the relation with a scatter plot and trend line and to predict the value of a variable when given the other...
Curated OER
Scatter Plots
In this scatter plots worksheet, students solve and complete 6 different problems. First, they create a scatter plot to illustrate how weight and height are related and determine their relationship as positive, negative or no relation....
Curated OER
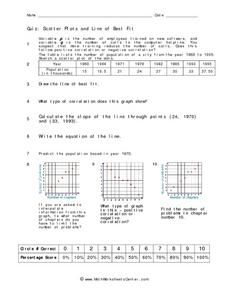
Quiz: Scatter Plots and Line of Best Fit
In this scatter plots and line of best fit worksheet, students create scatter plots from given sets of data. They answer questions concerning the scatter plot. Students write the equation of a line, identify the type of correlation...
Other popular searches
- Creating a Scatter Plot
- Scatter Plot Graphs
- Math Scatter Plots
- Scatter Plot Project
- Scatter Plot Trend Line
- Algebra Scatter Plots
- Creating Scatter Plots
- Scatter Plot Worksheets
- Correlating Scatter Plot
- Candy Scatter Plots
- Scatter Plot Notes
- Data for Scatter Plots


