Curated OER
Color Me Hot
Seventh graders use the scientific method, to observe, record and analyze the data they gathered. They make observations using their five senses. Students compare, contrast and draw conclusions based on the observations and data...
Curated OER
The Environment and Interactions of Living Organisms
Young scholars study the environment and interactions of living organisms. They identify abiotic and biotic factors and create a foldable and vocabulary cards. They create a poster illustrating soil and watch a video to study symbiosis.
Curated OER
Two-Step Linear Equations
In this two-step linear equations worksheet, 7th graders solve 15 various problems that include linear equations with more than one-step. First, they need to get the variable, x, alone by subtracting/adding the whole number on the same...
Curated OER
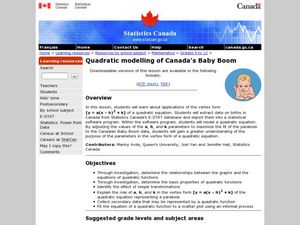
Quadratic Modeling Of Canada's Baby Boom
Students model quadratic equations. In this algebra lesson, students are given data to graph using a function. They investigate vertex and transformation of quadratic functions.
Curated OER
Modeling With Quadratics
Students investigate quadratics through word problems. In this algebra lesson, students models the number of registered males in apprenticeship programs. They investigate the transformation of quadratic function on a coordinate plane.
Curated OER
Modelling Periodic Phenomena
In this Pre-calculus/Trigonometry worksheet, students determine the trigonometric function that best models the given data. The eight page worksheet contains explanation, examples, and twenty-one problems. Answers are not included.
Curated OER
Graphing Linear Equations
Students graph linear equations. In this algebra lesson, students investigate the price of tolls in different states and create a graph. They analyze their graph and draw conclusions.
Curated OER
Understanding Equations of Functions
Students write equations for different functions. In this algebra lesson, students observe data and find the function that goes along with that data. The identify the line of best fit.
Curated OER
Proportions in Stories
Students solve problems dealing with ratios and proportions. In this algebra lesson, students rewrite word problems using equations and symbols. They correctly convert between percents and decimals.
Curated OER
Linear Modeling: Functions
Students analyze linear functions. In this algebra lesson, students create a linear model to relate coordinate pairs. They evaluate and solve equations.
Curated OER
Model Data with Quadratic Functions
Young scholars model data using quadratic equations. In this algebra lesson plan, students simplify and factor quadratic equations. They graph the function using collected data and analyze the parabola.
Curated OER
The Box Problem
Pupils create graphic, algebraic and verbal ideas of functions. In this algebra lesson, students graph functions and identify the zeros of the functions. They find the domain and range and classify functions as relation or not.
Curated OER
Circling Around the CEENBoT Way!
Young scholars investigate the forces present in a rotating body. In this physics lesson, students calculate centripetal force using a mathematical equation. They answer a quiz and writing prompt at the end of the lesson.
Curated OER
Optimization For Breakfast
Students identify he proportion of a cereal box. In this algebra lesson plan, students define the relationship between patterns, functions and relations. They model their understanding using the cereal box.
Curated OER
The Kangaroo Conundrum: A Study of a Quadratic Function
Students play a game and collect data for their graph. In this algebra lesson, students solve quadratic equations and identify properties of their graph. They describe the pattern created by the graph and the game.
Curated OER
A Study of a Quadratic Function
Students factor and solve quadratic equations. In this algebra lesson, students play a game as the collect and graph data. they identify properties of their parabola and make predictions.
Curated OER
The Swinging Pendulum
Students observe a pendulum and graph their observation. In this algebra lesson, students use the TI calcualtor to graph the motion the pendulum makes. They analyze the graph and make predictions.
Curated OER
What's The Point?
Students solve word problems using the correct math symbols. In this algebra lesson, students use the TI calculator to graph their equation and analyze it. They find the line of regression and use to draw conclusion.
Curated OER
Conductivity of salt Solutions
Students investigate the concentration level of solutions. In this math/science lesson, students identify three different ionic compounds. They predict the conductivity of each using their collected data.
Curated OER
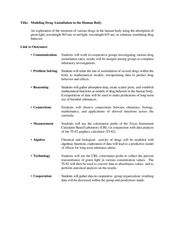
Modeling Drug Assimilation in the Human Body
Students investigate the accumulation of drugs in the body. In this algebra lesson plan, students collect data on drug retention and assimilation. They use their data to predict the behavior and effects of drugs.
Curated OER
The Hot Dog Stand - An Annual Report
Students run a computer simulation and collect data as they work and use the data to create an annual report for their business. It is desirable for students to do this project individually, but it could be done as a class using a large...
Curated OER
Finding Equations
Learners make equations from everyday data. They create a graph from the equations. Students predict and analyze the results. Learners complete the second scenario on their own and turn in their handout.
Curated OER
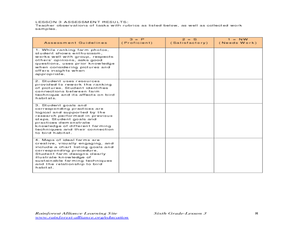
How can my breakfast help the birds?
Sixth graders design farms with a bird's habitat in mind. In this farm lesson plan, 6th graders research how sun grown coffee destroys a bird habitat, and then they make their own farm with a bird's habitat being preserved. They then...
Curated OER
Tanzania: Adapting and Modifying
For this Tanzania worksheet, students read a 1-page case study and then respond to 5 short answer questions based on the case study.
Other popular searches
- Math Scatter Plots
- Algebra Scatter Plots
- Creating Scatter Plots
- Candy Scatter Plots
- Data for Scatter Plots
- Pre Algebra/ Scatter Plots
- Interpreting Scatter Plots
- Prue Algebra/ Scatter Plots
- Halloween Scatter Plots
- Scatter Plots and Correlation
- Pr Algebra/ Scatter Plots
- Scatter Plots Ti 83


