Scholastic
Scholastic: Shake, Rattle & Roll
Students will learn and reinforce skills for creating and analyzing scatterplots and histograms; using cost-benefit analysis to make predictions from data and using tree diagrams to understand outcomes of events.
Shodor Education Foundation
Shodor Interactivate: Lesson: Stem and Leaf Plots
Lesson plan introduces students to stem-and-leaf plots. Many resources are available for student and teachers here.
ClassFlow
Class Flow: Data Analysis Using Graphing
[Free Registration/Login Required] This flipchart allows students to analyze data using appropriate graphs, including pictographs, histograms, bar graphs, line graphs, circle graphs, and line plots introduced earlier, and using...
Texas Instruments
Texas Instruments: Getting Started With the Ti Navigator: Exploring Change
This activity introduces students to Activity Center. In this activity, students will explore change in the context of cellular telephone charges. Students will create a scatter plot showing that the rate per minute for a "pay as you go"...
Texas Instruments
Texas Instruments: Finding Linear Models
Students graph a scatter plot, find average rate of change, develop a linear model, find a linear regression and a median/median line for a set of data graphed in a scatter plot and predict profit.
Texas Instruments
Texas Instruments: Math Today Is Leisure Time Really Shrinking?
Students will have the opportunity to organize data from the USA TODAY Snapshot "Is leisure time really shrinking?" into two scatter plots and determine the quadratic model for each scatter plot.
Illustrative Mathematics
Illustrative Mathematics: S Id.7 Texting and Grades
Medhavi suspects that there is a relationship between the number of text messages high school students send and their academic achievement. To explore this, she asks a random sample of 52 students at her school how many text messages...
Illustrative Mathematics
Illustrative Mathematics: 8.sp Animal Brains
This task looks at a possible relationship between the weight of an animal's body and the weight of its brain. Students make a scatter plot of data, look for outliers, make a second scatter plot without the outliers, and describe the...
Illustrative Mathematics
Illustrative Mathematics: 8.sp Birds' Eggs
A scatter plot showing data for the sizes of birds' eggs is presented. Students are to look for correlations and make predictions whose values fall within the data range. They are also to make generalizations about the characteristics of...
Texas Instruments
Texas Instruments: Old Mac Donald's Pigpen
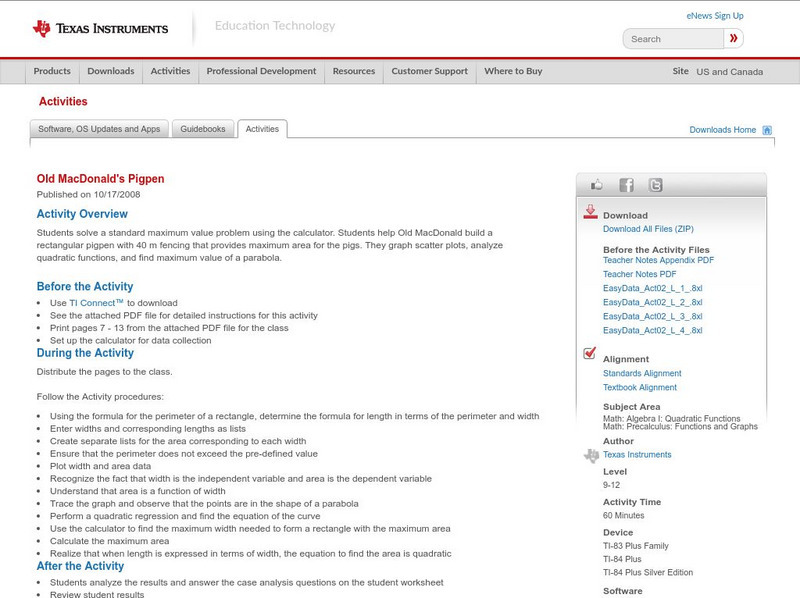
In this activity, students solve a standard maximum value problem using the calculator. Students help Old MacDonald build a rectangular pigpen with 40 m fencing that provides maximum area for the pigs. They graph scatter plots, analyze...
Texas Instruments
Texas Instruments: Math Today More of Us
In this activity students will investigate exponential functions and their graphs using real-life data. Students will analyze population data for the United States and create an exponential model for the scatter plot.
Texas Instruments
Texas Instruments: Exponential Growth Experiment
Students will work in pairs and will conduct a growth experiment. They will record their answers for 7 to 10 trials. They will make a scatterplot of their data and share their graphs with the class.
Texas Instruments
Texas Instruments: Is There a Limit?
In this activity, students examine data about bacteria and their growth. They produce a scatter plot, a best-fit model, and draw conclusions based on the data and graph.
Texas Instruments
Texas Instruments: Mc Dougal Littell Algebra 1: Perform Linear Regression
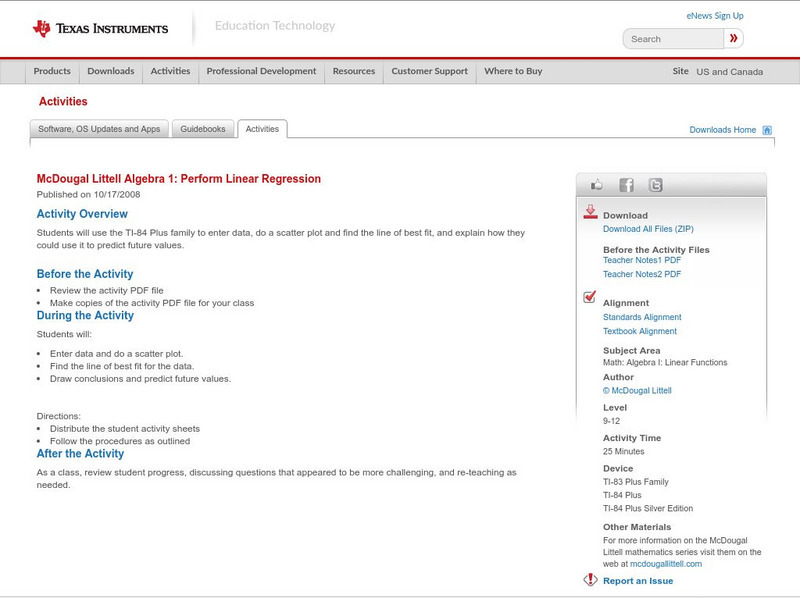
Students can use the TI-84 Plus family to enter data, do a scatter plot and find the line of best fit and explain how they could use it to predict future values.
Texas Instruments
Texas Instruments: Math Today: Internet Subscribers Soar
Students will create a scatter plot of the number of Internet subscribers during 2004 through 2008 using the USA TODAY Snapshot "Internet phone subscribers soar." This activity will allow students to explore real-life data that will be...
Texas Instruments
Texas Instruments: Muddy Water Adventure 8
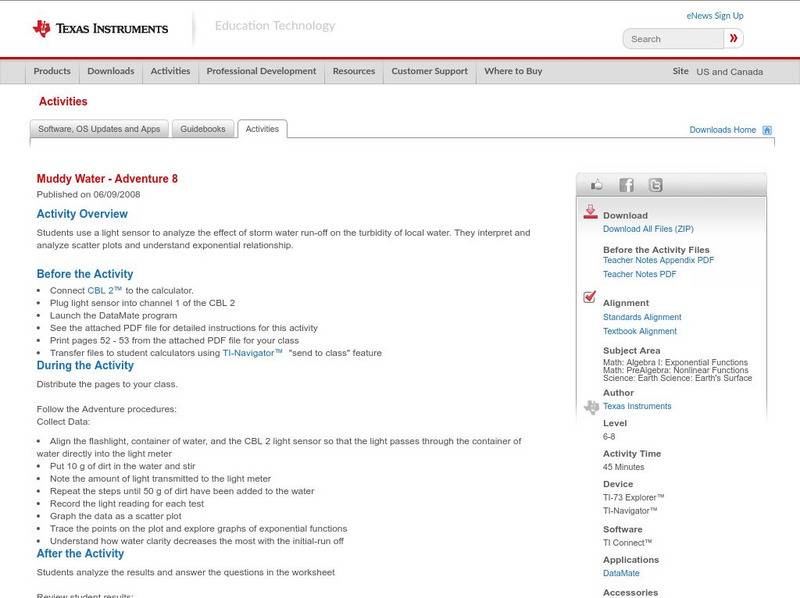
Students use a light sensor to analyze the effect of storm water run-off on the turbidity of local water. They interpret and analyze scatter plots and understand exponential relationship.
Texas Instruments
Texas Instruments: Muddy Footprints Adventure 11
In this adventure, students will analyze the relationship between height and stride length, and then use that information to identify the biker who left the footprints. They create a scatter plot, find the linear regression equation for...
Texas Instruments
Texas Instruments: Shoe Size vs Height
Students will be sent empty lists and need to send back their shoe size and height in inches. TI-Navigator will compile all lists and send compiled list to students. Students will then use the compiled list to make scatterplot and find...
Texas Instruments
Texas Instruments: Inverse of Two Temps
In this activity, students find a conversion equation that will calculate the corresponding Celsius temperature for any given Fahrenheit temperature. Students learn to graph scatter plots, analyze and graph linear equations, compute and...
Texas Instruments
Texas Instruments: A Wet Welcome Home Adventure 4
Students perform an experiment that simulates a leaking pipe and gather data on volume of water lost over time. They graph the data collected as a scatter plot, find the equation of the line of best fit, find the total volume of water...
Texas Instruments
Texas Instruments: Exploring the Golden Arches
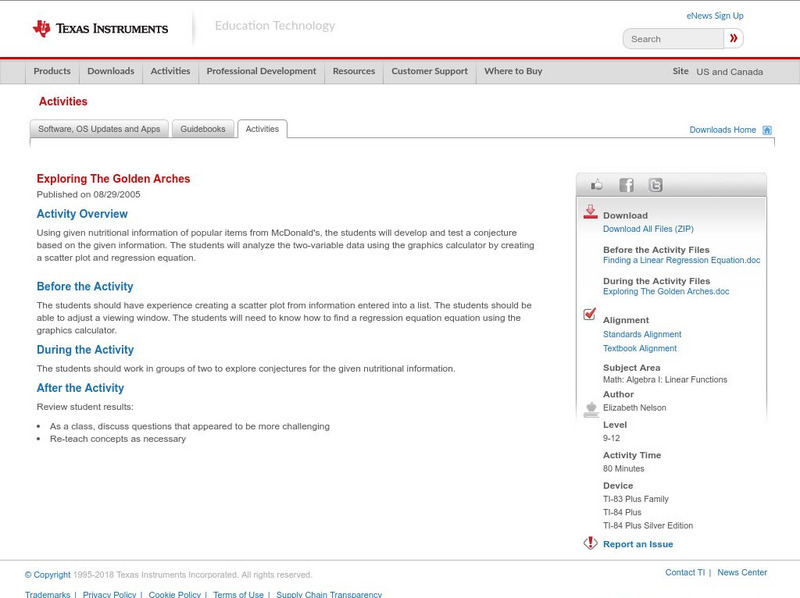
Using given nutritional information of popular items from McDonald's, the students will develop and test a conjecture based on the given information. The students will analyze the two-variable data using the graphics calculator by...
Texas Instruments
Texas Instruments: Numb3 Rs: How Tall Is the Criminal?
Based off of the hit television show NUMB3RS, this lesson introduces students to lines of best fit and their applications. While the extensions delve into correlation, the main lesson focuses only on collecting data, creating a...
Texas Instruments
Texas Instruments: Mc Dougal Littell Middle School Math: Making Data Displays
Students will create data displays using a scatter plot and a line graph of the data and a circle graph of survey data.
Other popular searches
- Math Scatter Plots
- Algebra Scatter Plots
- Creating Scatter Plots
- Candy Scatter Plots
- Data for Scatter Plots
- Pre Algebra/ Scatter Plots
- Interpreting Scatter Plots
- Prue Algebra/ Scatter Plots
- Halloween Scatter Plots
- Scatter Plots and Correlation
- Pr Algebra/ Scatter Plots
- Scatter Plots Ti 83


