Baylor College
Body Strength
Your young learners will discover how muscular strength and endurance can increase with this truly hands-on activity! Beginning by writing an acrostic for the word strength, class members then engage in tracking their ability to squeeze...
NOAA
Climate, Weather…What’s the Difference?: Make an Electronic Temperature Sensor
What's the best way to record temperature over a long period of time? Scholars learn about collection of weather and temperature data by building thermistors in the fourth installment of the 10-part Discover Your Changing World series....
Radford University
Let's Buy a Car
Ready to buy a car? Learners research different makes and models of cars to decide on the best one to buy. They collect data on cost, fuel efficiency, safety ratings, and insurance costs, then create and analyze data displays to make...
PBS
Exoplanets through Kepler’s Laws
The majority of all confirmed exoplanets relied on Kepler's laws to discover their locations. Scholars learn how to apply Kepler's laws and then practice using data to discover exoplanets. They benefit from NASA video footage, NOVA...
Howard Hughes Medical Institute
DNA Sequence Assembly
Oncologists use DNA sequence data to identify specific cancers and offer more targeted treatments. Grasp an understanding of the complexity involved by learning how the body sequences and assembles DNA. Eager scientists explore the...
College Board
2018 AP® Biology Free-Response Questions
The average AP Biology score dropped in 2018 with the addition of more data tables and graphs. Offer additional practice free-response questions by using the questions from the 2018 AP exam covering phylogenetic trees, cell structure and...
Las Cumbres Observatory
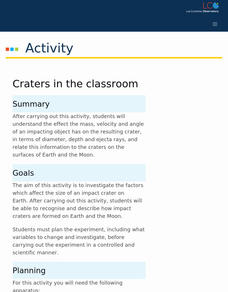
Craters in the Classroom
Laws of motion apply both in space and on Earth. Young experimenters model object impact on the Earth and moon. They use data to determine the effect mass and velocity have on the resulting craters and how that relates to the energy of...
Howard Hughes Medical Institute
Mass Extinctions Interactive
Extinctions constantly occur, but what sets off a mass extinction event? Young scientists study the data from the previous five mass extinctions to better understand their causes. Then, they learn the impact each extinction had on our...
University of Georgia
Endothermic and Exothermic Reactions
Equip your chemistry class with the tools to properly understand endothermic and exothermic reactions. Young chemists collect, analyze, and graph data to determine how the Law of Conservation of Matter is applied to chemical...
Cornell University
Non-Newtonian Fluids—How Slow Can You Go?
Children enjoy playing with silly putty, but it provides more than just fun. Young scientists make their own silly putty using different recipes. After a bit of fun, they test and graph the viscosity of each.
Virginia Department of Education
Prokaryotes
Lead your biology class on a cell-sized adventure! Emerging scientists construct models of prokaryotes, then design an experiment to properly grow a bacterial culture. They conclude the activity by viewing the culture under a microscope....
American Chemical Society
Evaporation
This is one in several lessons that explore the relationship between temperature and phase changes of water. After some discussion, elementary physical scientists place wet paper toweling on a hot and a room-temperature water bag...
Curated OER
Learning to Make Data Tables
Students construct data tables using the results of previous experiments. In this graphing lesson, students plot data and interpret the results. Students discuss how they organized their data.
Curated OER
Learning to Make Bar Graphs
Young scholars construct bar graphs using the results from various experiments. In this graphing lesson, students review data from a previous experiment and demonstrate how to construct a bar graph. Young scholars use a checklist to...
Curated OER
Tables, Charts and Graphs
Young scholars examine a science journal to develop an understanding of graphs in science. In this data analysis lesson, students read an article from the Natural Inquirer and discuss the meaning of the included graph. Young...
Curated OER
Plotting Data on a Graph
Students investigate graphing. In this graphing instructional activity, students survey the class and create graphs to reflect the data collected.
Curated OER
Data Sampling
Students discover data sampling. For this science lesson plan, students explore data sampling and turn the data collected into useful information by making graphs and using them to solve problems.
Curated OER
Graphing Climate Information
Seventh graders plot the data for the average monthly precipitation for three cities. They make a graph using a spreadsheet.
Curated OER
Interpreting Medical Data
Students explore human anatomy by graphing scientific data. In this vision instructional activity, students discuss how ophthalmology works and take their own eye assessment test using the Snellen chart. Students collect vision data from...
Curated OER
Sorting and Graphing Animals
Students inquire about animals using SIRS Discoverer or eLibrary Elementary. In this organizing data lesson, students sort pictures of animals in various ways and develop graphs. Students locate a mammal, reptile, fish, insect or...
Curated OER
Graphing the Facts
Students investigate the correlation between our planet's weather and solar activity. They analyze and discuss data regarding the solar activity cycle, graph annual precipitation and temperature averages over a period of 100 years, and...
Curated OER
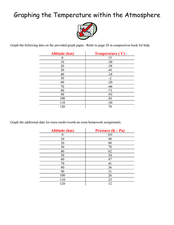
Graphing the Temperature within the Atmosphere
Musing meteorologists design graphs of the temperature and pressure changes for altitude increase in our atmosphere. The activity is pertinent to middle school earth science curriculum. Vary the type of homework you assign when teaching...
Curated OER
Water Chestnut Graphing Activity
Students are taught how to format and enter data into an Excel spreadsheet. They make a graph and interpret graphed data. Students discuss possible impacts of water chestnut invasion. They graph data on water chestnut. Students report...
Curated OER
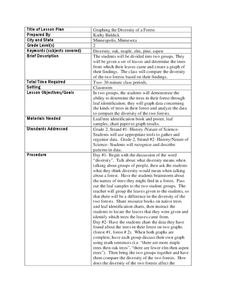
Graphing the Diversity of a Forest
Second graders work in groups to identify what types of trees create which types of leaves In this plant life lesson plan, 2nd graders analyze a set of leaves and identify the tree it came from while graphing the data in a science...


