Shodor Education Foundation
Scatter Plot
What is the relationship between two variables? Groups work together to gather data on arm spans and height. Using the interactive, learners plot the bivariate data, labeling the axes and the graph. The resource allows scholars to create...
Virginia Department of Education
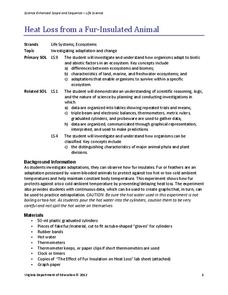
Heat Loss from a Fur-Insulated Animal
How do animals adapt to weather changes? Provide your class with the ability to understand adaptations and body temperature as they participate in this hands on experiment, using fake fur and hot water. Pupils collect data and analyze...
Virginia Department of Education
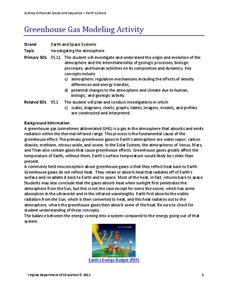
Greenhouse Gas Modeling Activity
Why are greenhouse gases called greenhouse gases? Young Earth scientists learn about greenhouse gases though experimentation in the second installment of a 3-part series. They use lamps to model radiant energy as well as warming through...
University of Georgia
Heating and Cooling of Land Forms
Compare heating and cooling rates of different land forms. A lab activity has groups collect data on the rate of heating and cooling of soil, grass, saltwater, fresh water, and sand. An analysis of the rates shows how the different land...
InqueryPhysics
Interpreting Motion Graphs
Every movement in the world can be measured and even motionless objects can be significant indicators of movement. Focus on motion graphs that feature distance vs. time, speed vs. time, and positive and negative acceleration.
Chymist
The Solubility of a Salt in Water at Various Temperatures
An educational activity allows young chemists to test the solubility of different types of salt at various temperatures. Groups create a graph using data from unsaturated, saturated, and supersaturated solutions.
Curated OER
Using My Nasa Data To Determine Volcanic Activity
Students use NASA satellite data of optical depth as a tool to determine volcanic activity on Reunion Island during 2000-2001. They access the data and utilize Excel to create a graph that has optical depth as a function of time for the...
Curated OER
Using SWMP Data
Students are introduced to the SWMP system which tracks short-and long-term changes in water. Using this data, they plot and interpret the data on a graph to determine how human activities are lowering the water quality. They also...
Curated OER
Graphing And Data Presentation
High schoolers engage in a study of science and mathematics with the practice of creating graphs. A guest speaker comes to the class to share statistics from the community and the students are shown how he uses the coordinate system in...
Curated OER
Epidemiology: Graphing and Analyzing Health Data
Students graph data on fetal and infant mortality rates collected by the Centers for Disease Control and Prevention. They identify trends in the data and propose potential causes for the trends.
Curated OER
Deciding Which Type of Graph is Appropriate
In this graphing instructional activity, students read about line, bar, and pie graphs and then determine which graph is the best way to express data results. This instructional activity has 3 short answer questions.
Curated OER
Dough Lake Topology
Students practice coordinates and measurements, develop 2D, 3D topological map, construct grid with string on real surface, establish "level" fixed point for measurements, take and record data points of elevation, and enter data on...
Curated OER
Oil and Energy Consumption
Young scholars analyze the oil consumption and production information. In this investigative lesson students take the data collected, graph and organize it then draw conclusions about the use of oil worldwide.
Curated OER
Sweethearts and Data Analysis
Learners explore the concept collecting and representing data. In this collecting and representing data lesson, students record the different colors of sweetheart candies in their sweethearts box. Learners create a table of the data and...
Curated OER
Graphing Sea Ice Extent in the Arctic and Antarctic
Students graph sea ice data and predict long term trends in the data. In this climate change lesson, students use sea ice data from the Arctic and Antarctic to construct line graphs. They use their graphs to predict the effects of global...
Curated OER
Beverage Tests
Learners investigate the pH of a liquid. In this middle school mathematics/science lesson, students collect and analyze data regarding the pH of various liquids. Learners display their data in various types of graphs as they consider...
National Security Agency
Are You Ready to Call the Guinness Book of Records?
Learners design questions that can be answered by collecting data. In this line-plot lesson, pupils collect data and graph on a line plot on world records. An abundant supply of teacher support is provided in this resource.
Curated OER
Mystery Liquids: Linear Function
High schoolers determine the linear equations of the density of water and oil by collecting data on the mass of various volumes of each liquid. They construct scatter plots from the data and use these to write the linear equations for...
McGraw Hill
Population Biology
The carrying capacity of an environment varies based on the organisms that live there. Using a virtual lab simulation, scholars test two protists living in their own environments and a third environment where both protists live. They...
Cornell University
Energy Changes in Chemical Reactions
The heat of solution measures how much thermal energy a dissolving substance consumes or gives off. The experiment demonstrates both endothermic and exothermic reactions. Scholars dissolve several substances, measure the temperature...
Curated OER
The Effect of Dissolved Salt on the Boiling Point of Water
Explore the properties of solutions with a lab activity. Chemistry fans determine the boiling point of water, add salt to create a solution, and then repeat the process four more times. They design their own data table and then graph the...
Curated OER
Quadratic Equations with the CBL 2
Learners practice generating parabolas with a motion sensor while determining the vertex form of the equation. They compare it to the regression equation from the calculator onto a data mate software. Each student completes several...
Rainforest Alliance
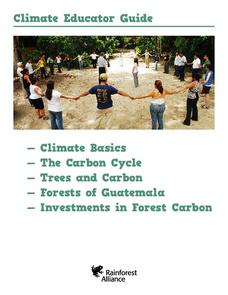
Climate Educator Guide
Climate change is a hot topic in the news. Class members examine carbon dioxide data to analyze trends of our atmospheric makeup over time. They also discuss climate and climate change, and determine how these changes are affecting life...
Curated OER
Introduction to Graphs: Bar Graphs, Line Graphs, Circle Graphs
In this graphing data worksheet, students answer 5 short answer questions about graphs. Students determine which type of graph best represents various data sets.


