Oregon State
Using Paper Chromatography
Through the analysis of paper chromatography to separate ink from the pen found at the crime scene, learners analyze the different stains and through calculations determine the thief.
Curated OER
Ocean Temperatures
Students list data collected by marine buoys and the different kinds of moored buoys. They describe how data is transmitted worldwide. They explain the difference between near shore and offshore air and water temperatures.
Curated OER
Peat Pots
Students place a peat pot in water to observe and calculate the rate of capillarity in a model of a soil. This task assesses students' abilities to make simple observations, collect, record, and represent data, use a data table to...
Curated OER
How Creepy!
Students observe and measure a model of slow down slope movement. In this graphing lesson students collect, record, and organize data that apply to models.
Curated OER
My Peanut Butter is Better Than Yours!
Students explore the concept of statistical data. In this statistical data lesson, students read an article about the dangers of peanut butter to those who are allergic. Students perform a taste test of two different brands of peanut...
Curated OER
Acid-Base Titration
Students determine the concentration of an unknown solution. This task assesses students' abilities to state hypothesis, develop procedures for investigation, plan for recording and organizing observations and data, collect data, create...
Curated OER
Bats and Hot Dogs
Students identify patterns and relationships from data that is collected and solve variables. In this investigative lesson students study ocean productivity, the nitrogen cycle and phytoplankton then answer questions.
Curated OER
Mapping River Statistics
Students research different statistics to do with the Mississippi River. They answer questions about finding data and collect it by conducting research. The research is used to construct a data table. Then students use the table to...
Curated OER
The Great Race
Students identify the mean, median and mode of collected data. In this statistics instructional activity, students collect, graph and analyze data using central tendencies. They work in groups to collect data on a robot through an...
Curated OER
Earthquake on the Playground
Learners investigate earthquakes by examining chart data. In this disasters instructional activity, students identify the waves that are recorded when an earthquake arises by reading sample graphs in class. Learners participate in an...
Curated OER
Hurricanes and Climate
Students investigate maps and data to learn about the connections between hurricanes and climate. In this exploratory lesson students describe and graph the 6 regions where hurricanes happen and discuss how hurricanes have changed over...
Curated OER
Paper Gliders
Sixth graders study friction and drag. In this science lesson, 6th graders use different models of gliders and test to see which of the gliders fly the farthest. Students analyze their data and construct a graph.
Curated OER
Science and Technology
Students research inventions that have been created. In this historical technology lesson, students read the Harcourt Brace social studies textbook and discuss how inventors used graphs to display data. Students create a table to write...
Curated OER
Climate Systems - Which Location Is Best For Me?
Students study the difference between weather and climate. In this climate systems lesson students search the Internet for the parts of the Earth's system, gather climate data and complete a challenge scenario.
Curated OER
Hand Sensitivity
Students experiment with the sense of touch. In this tactile lesson, students determine the most sensitive area of the hand. Students experiment by describing objects through touch only. Students compare the amount of sensory data...
Curated OER
Probing Under the Surface
Eighth graders use a measuring stick to determine the shape of the inside of the bottom of a box, then apply their knowledge to an additional situation. This task assesses students' abilities to make simple observations, collect and...
Curated OER
Bell Curve
Students explore averages by completing a data analysis activity. In this bell curve lesson, students measure different food items and plot their measurements on a X and Y axis. Students create bell curves around the average weight or...
Curated OER
Graphing in an Experimental Context
Seventh graders discuss the importance of being able to represent scientific data in the form of graphs. They comprehend the differences between a bar graph and a line graph. Students identify the type of data with which each graph...
Curated OER
Graph a Panther's Diet
Pupils examine the diet of panthers. In this interpreting data instructional activity, students collect data on the panther's diet and chart the data in bar and pie graphs.
Curated OER
Growing Plants
Students grow plants and track their growth over time. For this growing plants lesson, students plant seedlings and chart their growth in a data analysis activity.
Curated OER
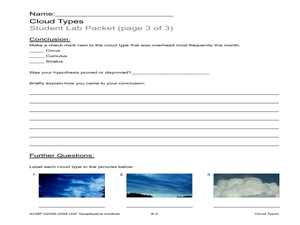
Cloud Types
Students examine cloud types. In this cloud lesson, students identify cloud types, observe clouds and collect data, and analyze data to identify the most common cloud they observe overhead during the course of a month.
Curated OER
Is It There?
Students participate in a lesson designed to illustrate these concepts using simple materials. They use Science process skills to observe, measure, predict, make inferences, and communicate while completing the activity. Proper safety...
Texas Instruments
Finding Linear Models Part III
Explore linear functions! In this Algebra I lesson, mathematicians graph data in a scatter plot and use a graphing calculator to find a linear regression and/or a median-median line. They use the model to make predictions.
Curated OER
Bouncing Ball
Students collect height versus time data of a bouncing ball using the CBR 2™ data collection device. Using a quadratic equation they graph scatter plots, graph and interpret a quadratic function, apply the vertex form of a quadratic...


