Chicago Botanic Garden
Climate Change Around the World
It is unknown if cloud cover increases in response to carbon dioxide levels changing, helping climate change slow down, or if cloud cover decreases, allowing Earth to warm faster. Part four in the series of five lessons has classes...
Curated OER
A Research Project and Article For the Natural Inquirer
Get your class to use the scientific process to solve a scientific problem. They utilize the Natural Inquirer magazine to identify a research question which they write an introduction to and collect data to answer. They use graphs,...
Curated OER
Waves
Light waves and sound waves are the focus of this science lesson designed for 5th graders. Besides discovering how these waves travel, learners also discover the basic properties of waves, and analyze data tables and graphs. The...
Curated OER
How Are Stars Like People?
A beautifully written lesson plan delves into a beautiful topic: stellar population. Engage aspiring astronomers with activities that examine human populations and then transition onto the stars of the universe. Data and photographs for...
Curated OER
Historical Pollution in the Hudson: Part 2
Ninth graders practice how to format and enter data into an Excel spreadsheet, make a graph, and interpret graphed data. They recognize how the pollution in the Hudson River has changed over time, and explain the consequences of these...
Curated OER
Wetland vs. Stream Macroinvertebrates
A link to a comprehensive macroinvertebrate guide gives you the information needed to prepare for this field study activity. Sample macroinvertebrates are collected from areas representing different environmental conditions. Junior...
It's About Time
Newton's Law of Universal Gravitation
While science is looking for correct explanations, pseudoscience often fills in the blanks. Pupils explore the relationship between light distance and intensity and graph their data. Then they compare their data to Newton's Law of...
Howard Hughes Medical Institute
Niche Partitioning Activity
Dinnertime on the African savanna is a highly choreographed event! Introduce young ecologists to the concept of niche partitioning through a hands-on activity. Pupils research animal behaviors and use data to develop an understanding of...
Teach Engineering
Start Networking!
Class members create their own social networks by collecting signatures before graphing the interactions with their fellow classmates. The degree distribution of the simulated social network is determined by calculating the degree of...
NOAA
El Niño
El Nino, La Nina ... and the Santa Maria? The 11th installment of a 23-part NOAA Enrichment in Marine sciences and Oceanography (NEMO) program explains the mechanism of El Nino/Southern Oscillation. Pupils use previous data to determine...
Space Awareness
The Thermal Layers of Oceans
How much does the sun heat up a lake or ocean? Scholars use a cup and a strong lamp to investigate the heat transfer and thermal layers in the ocean to come up with the answer. They collect data and graph it in order to better understand...
Curated OER
# 21 Measuring Nitrate by Cadmium Reduction
Students design an experiment to evaluate the effects of various treatments on the nitrogen cycle in a freshwater aquarium. They are required to maintain a laboratory notebook of all work, measure the key analytes of the biosystem at...
Curated OER
Polar Bears in Peril - Climate Change Culprit?
Learners explore the changes in sea ice over several years. In this life science lesson, students review and examine 20 years of data. They use Excel to graph data and analyze trends.
NOAA
Biological Oceanographic Investigations – Signals from the Deep
The Deepwater Horizon oil spill directly impacted an area of the Gulf of Mexico the size of Oklahoma. A marine biology instructional activity looks at the impact of an oil spill on the deeper parts of the ocean. Scholars download actual...
Curated OER
Understanding Weather and Climate Patterns
Students research the climate patterns of various locations and make predictions based on their findings. They determine the importance of latitude and longitude in weather and climate. Students create graphs displaying their collected...
It's About Time
Volcanic Hazards: Airborne Debris
Pupils interpret maps and graph data related to volcanic ash. Then they analyze the importance of wind speed and the dangers of the ash to both life, air temperature, and technology.
Cornell University
Math Is Malleable?
Learn about polymers while playing with shrinky dinks. Young scholars create a shrinky dink design, bake it, and then record the area, volume, and thickness over time. They model the data using a graph and highlight the key features of...
Curated OER
Dissecting Owl Pellets
Students watch the teacher model the dissection then in pairs, they dissect an owl pellet and identify its contents. They record the data about its prey on a graph.
Curated OER
Can a Mouse Lift an Elephant?
Read Just a Little Bit, by Ann Tompert as an introduction to levers. Discuss playground seesaws and then turn learners loose to experiment with the placement of a fulcrum. Their goal is to determine where to place it in order to lift ten...
Curated OER
Cosmic Chemistry: An Elemental Question
Space scientists investigate the cosmic phenomena in order to search for answers to possible origins of the solar system. They consider the concepts of elements and isotopes. Data is analyzed looking at tje abundance of elements...
Curated OER
Feeling the Heat
Pupils record temperatures at different locations around campus. They examine the results and draw conclusions about how materials and colors affect the amount of heat produced. They also analyze Los Angeles' temperature records over a...
Nuffield Foundation
Intrepreting Information about Sweating and Temperature
Why do we sweat? Scholars analyze data about body temperature, sweating, and other factors to better understand sweating. They note the changes after drinking ice water to sweating, skin temperature, and body temperature. Analysis...
NASA
Connecting Models and Critical Questions
Scholars use data to analyze and determine which sets of information need to be counted. They create a model to explain differences among chemical elements using graphs to prove concept mastery.
Curated OER
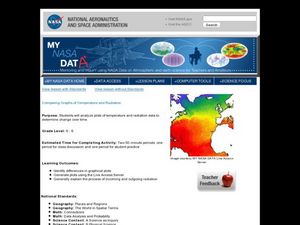
Comparing Graphs of Temperature and Radiation
Middle schoolers study plots and use a Live Access Server to generate plots. In this temperature lesson students examine the process of incoming and outgoing radiation.


