Curated OER
Body Voyager
Students explore the significance of a resting and an active heart rate. In this heart lesson students chart data on their pulse and draw a diagram of the heart.
Curated OER
At the Edge of the Continent
Students study how to interpret a bathymetric map. They study the main features of the continental margin. They plot and graph bathymetric data. They think about and discuss the bathymetry of the edge of the cont
Curated OER
Ocean Currents and Sea Surface Temperature
Students use satellite data to explore sea surface temperature. They explore the relationship between the rotation of the Earth, the path of ocean current and air pressure centers. After studying maps of sea surface temperature and ocean...
Curated OER
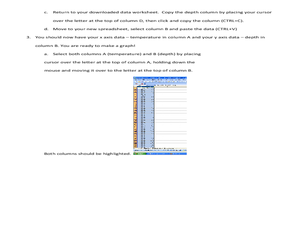
Get a Half-Life!: Student Worksheet
In this math/science worksheet, students will work in pairs to conduct an experiment based on a decay function which is often used to model radioactive decay. Students will shake M & M's in a cup to rub off the M and then record...
Curated OER
What's A Water Column Profile?
Learners investigate water column data. In this earth science and seawater instructional activity, students determine how temperature, salinity, and density have an impact on sea water by viewing and analyzing data obtained from a number...
Curated OER
Temperature in the Sun or Shade of the Desert
Third graders use thermometers to measure the air temperature in several
places around the school and then return to the classroom to record the data. They create a bar graph and discuss their findings about the air temperature in the...
Curated OER
Frost Depth
Learners explore the concept of frost depth. In this frost depth lesson, students conduct a scientific investigation that requires them to use a frost tube to measure, record, and graph frost depth data.
Curated OER
Water Cycle, Weather, and Climate
Eighth graders investigate the water cycle and its processes. They examine temperature and precipiation data to classify climate of ten cities. They then create a climate map of the world.
Curated OER
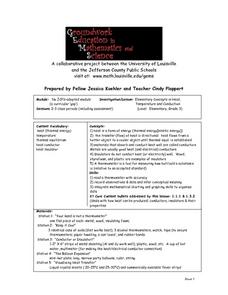
Elementary Concepts in Heat
Third graders read a thermometer with accuracy, record observations and data, and infer conceptual meaning. They integrate mathematical charting and graphing skills to organize their data. They explore what happens when they touch or use...
Curated OER
Density Lab
Students find the density of two substances. In this density lesson plan, students determine the density of water and ethyl alcohol and compare their densities. They enter their data into the computer to produce a class compiled graph....
Curated OER
Earth Energy Budget Pre Lab
Students explore energy by conducting an in class experiment. In this climate change lesson, students conduct a water vapor experiment in a soda bottle. Students utilize graphs and charts to analyze the results of the experiment and help...
Curated OER
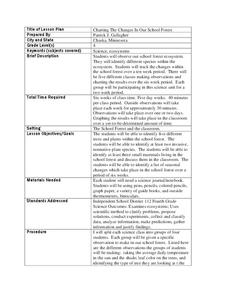
Charting the Changes in Our School Forest
Fourth graders investigate the ecosystem and how forests are disappearing. In this environmental protection lesson, 4th graders analyze the changes in their school for 2 weeks. Students practice identifying trees, birds, and foliage...
Curated OER
Bottle Habitat
In groups of four, students construct aquatic habitats in pop bottles. They create charts and record data from observations over a four week period. Then they graph their data and write explanations for what they observed.
Curated OER
School Lighting Audit
Learners identify the data included in an energy audit. They perform an audit on the lighting in their school building. They complete a worksheet and discuss lighting issues with school staff.
Curated OER
Teaching Radioactive Decay: Radioactive Half-life And Dating Techniques
Students generate a radioactive decay table for an imaginary element using a box filled with pinto beans and M&M's. They use their data to plot a decay graph, develop the concept of half-life, and use the graph to "age" several samples.
Curated OER
Exponential Decay
Students study exponential decay and its application to radiocarbon dating. In this exponential decay lesson, students use candy to model the time it takes for something to decay. Students also graph the data they collect and describe...
Curated OER
Why is it so hot when I sit next to the window?
Students investigate how energy travels through glass. In this energy usage lesson, students conduct an experiment in which they decide if window film affects how much energy travels through the glass. Students use a journal to make...
Curated OER
Structure of Seeds and Effects of Fertilizer on Plant Growth
Investigate the structure of seeds and the effects of fertilizer on the growth of plants. Young scientists observe a peanut and determine if it is a monocot or dicot plant. They plant seeds and make varying solutions of fertilizer, then...
Curated OER
TE Lesson: Factors Affecting Friction
Students investigate the effect of weight on normal friction or the friction due to surface roughness. They tell about the effects of contact area that occurs as a result of molecular attraction by looking at data on line graphs.
Curated OER
What's the Fizz Factor
Students as a class create a fountain using both coke soda, and mentos candy. In this science activity, students test which combination of coke and mentos products produce the tallest fountain. Students use the scientific method to track...
Curated OER
How Do We Solve the Problem of Wildlife on Our Roads?
Students analyze data on elk ecology and movements across the highway. In this ecology lesson, students research ways to save them from highway collisions. They write a report and present their findings in class.
Curated OER
Volume of Gas
Eighth graders investigate the effect of temperature on the volume of a gas in a closed container. They measure the height of the water in their beaker/container, conduct their experiment, and create a graph to illustrate their data.
Curated OER
What's in the Water?
Fifth graders use the dots to simulate water pollutants in a lake. They use cups to collect a sample of "water." Students sort the dots by color and record the number of each dot color under the correct pollutant name in the Lake Water...
Curated OER
Fizzy Pop
Fifth graders compare and identify variables that affect the rate of a chemical change using Alka-Seltzer, water, ice, and hot water. They time how long each variable takes to pop the canister into the air, and record the results on a...


