Curated OER
Active Wear
Students interpret and analyze data. In this middle school mathematics lesson, students conduct an experiment in which they investigate which solar collector, black, white, or silver, absorbs the most heat. Students examine the graphs...
Curated OER
Effects of Temperature, Deviation on Climate
Young scholars collect and record data for a given city. They calculate standard deviation of temperature and analyze the impact of climate changes on a city's and culture.
Curated OER
Graphing Changes in Weather
Students graph current temperature and weather conditions for three days. For this weather lesson, students go to the Weather Channel's website and look up weather for their zip code then graph the conditions and record the current...
Beyond Benign
Water Bottle Unit
How much plastic do manufacturers use to create water bottles each year? The class explores the number of water bottles used throughout the years to determine how many consumers will use in the future. Class members compare different...
Howard Hughes Medical Institute
Tracking Genetically Modified Mosquitoes
What's that buzzing in your ear? An insightful lesson about genetically modified mosquitoes! Partnered pupils explore the creation, release, and monitoring of mosquitoes designed to reduce the mosquito population. After watching a video,...
Cornell University
Sound Off!
Time to witness the effects of sound. Learners analyze different materials to determine their abilities to absorb sound waves. They use free software to monitor the amplitude of the waves to verify results.
Curated OER
Parts of a Plant
First graders discover the parts of a plant. In this science instructional activity, 1st graders identify and label the parts of a plant and record their findings on a word processor.
Curated OER
Acceleration Science
In collaborative groups, physics learners design and create a web portfolio of internet resoucres explaining poitive and negative acceleration, zero acceleration, and positive and negative velocity. This is a terrific assignment for...
Sea World
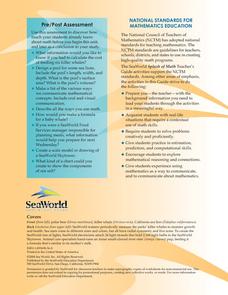
Splash of Math
How can kids use math to learn about marine life? Combine math skills with science lessons in a resource featuring activities about life in the sea. Kids graph and calculate data, solve complex word problems, measure geometric shapes,...
Curated OER
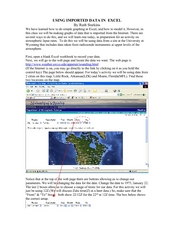
Using Imported Data in Excel
Students import atmospheric data from the internet. In this earth science lesson, students graph the data they collected. They complete the worksheet after the activity.
Curated OER
Graphing the Elephant Seal Population Data
Young scholars are able to graph data that they generated in the elephant seal exercise using proper format and labeling. They are able to interpret the graphs they created and make A) conclusions, and B) predictions based on that graph.
Curated OER
The Statistical Nature of Test Data
Students investigate the properties of various metals. They conduct an experiment and gather the data by putting into the proper statistical graphs. The data is analyzed and conclusions are formed according to the properties of the metals.
Curated OER
Patterns of Evolution and Selection
Can your young biologists interpret population graphs, match macroevolution patterns and descriptions, and answer multiple choice questions about evolution? Find out with a comprehensive three-page quiz covering some specific examples of...
Curated OER
Rain Forests: A Disappearing Act?
Students examine and locate rainforests on maps, and research the patterns of their destruction. They develop a bar graph of rainfall and temperature data, write a journal entry, and research the people, animals, and plants/products of...
Michigan Sea Grant
What's in This Water?
Pupils investigate the biological and chemical characteristics of water to determine where purple loosestrife occurs. They create data sheets to record water quality tests in several locations and work in groups to conduct the water...
Curated OER
What's Cooking?
Students investigate solar energy by making sun tea. In this ecology and solar energy lesson, students prepare traditional tea and "sun" tea, then record and graph data comparing color, clarity, smell and taste.
Curated OER
Blast Off
In this physical science exploration, small groups place a piece of antacid tablet into a film canister and step back to time how long it takes for the top to pop. They repeat the activity, altering either the amount or temperature of...
Curated OER
Graphing the Standard Curve
Learners analyze colorimetric using a computer program. In this science lesson, students show application of standard curves by finding other areas of science where standard curve is analyzed.
Curated OER
Analysis of Atmospheric Conditions for a High Mountain Retreat
Students examine the relationship between altitude, atmospheric pressure, temperature and humidity at a particular location. They practice science and math in real world applications. They write reports detailing their scientific...
Texas Instruments
Data Collection for Bar Graphs
Learners study the concept of central tendency in this data collection for bar graph lesson. They collect data outside as instructed and organize it into a bar graphs, then they list in specific groups the labels that appear on the...
Curated OER
The Effect of Temperature on Solubility
In this solubility worksheet, students conduct an experiment to see how temperature effects the solubility of salt in water. Students record their data in a chart and then graph the results. Then students complete 2 short answer questions.
Curated OER
More Rocket Science
Young scholars observe two rocket science experiments, and create a graph to demonstrate the results. They draw a picture and write an explanation of the results of the experiments.
Curated OER
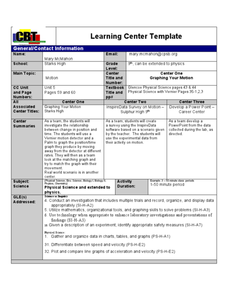
"Graphing Your Motion"
Students study the concepts of motion, velocity, and acceleration through graphing their own movement using LoggerPro. They explain the difference between speed and velocity using the weather vane example. They discover the difference...
Curated OER
Graphing Speed
In this graphing worksheet, students read about independent and dependant variables and learn how to determine speed from the slope of a position vs. time graph. This worksheet has 4 matching, 17 fill in the blank, and 2 problems to solve.


