Curated OER
Getting the Lead Out
The article for this instructional activity no longer accessible through the links in the lesson plan, but can be found in the National Center for Biotechnology Information website. After reading it, environmental science students answer...
Curated OER
Significant Science: Statistics for Planet Earth
Ninth graders discover how statistics are used to interpret results of scientific experiments. Students write hypotheses and test the hypotheses by collecting data and organizing the data. Students graph their data to produce a visual....
Curated OER
Does cloud type affect rainfall?
Student use MY NASA DATA to obtain precipitation and cloud type data. They create graphs of data within MY NASA DATA. Students compare different cloud types, compare precipitation, and cloud type data They qualitatively describe graphs...
NASA
Discovering the Milky Way
What do you call a tiny collection of galaxies? A puny-verse! Young scholars graph data gathered by scientists studying Cepheids. They attempt to identify a relationship between the variables through standard and logarithmical graphing....
NOAA
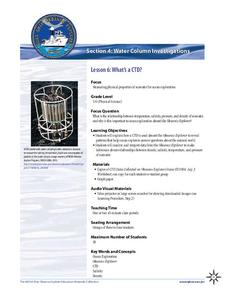
What's a CTD?
Why are the properties of the water important when exploring the ocean? Young scientists discover the tools and technology used in deep sea exploration in the fourth installment in a five-part series. Groups work together to examine...
Curated OER
The Scientific Method, Blood Typing, and Antibiotic Resistance
Students are given some components of an experiment, where they are able to identify and fill in missing parts, such as hypothesis, conclusion, results, etc. They form a hypothesis given general scientific facts. Students apply the...
Virginia Department of Education
Determining Absolute Age
How can radioactive decay help date old objects? Learners explore half-life and radioactive decay by conducting an experiment using pennies to represent atoms. Young scientists graph data from the experiment to identify radioactive decay...
Curated OER
Go Fish!
So much science in one tiny fish! Introduce young biologists to the zebrafish, a common aquarium inhabitant. The small, unassuming organism presents an opportunity for learners to study habituation using an easy-to-care-for species. Lab...
Curated OER
Science: Lead Shot and Waterfowl
Students examine data to investigate the impact of lead shot pellets on waterfowl populations. They graph their findings and discover how lead in ingested by birds and poisons them. As an extension, students research legislation and...
Curated OER
What's My Pattern?
Students recognize, describe and extend patterns in three activities. They organize data, find patterns and describe the rule for the pattern as well as use the graphing calculator to graph the data to make and test predictions. In the...
Curated OER
Probability
Here is a classic activity used to introduce your class to the concept of probability and data collection. They will roll one die 30 times, then record and discuss the results. Great introduction, but too shallow to be considered a...
Curated OER
Ozone and Temperature Data Analysis, South Pole Antarctica
Students discuss the layers of the atmosphere, and the history of the ozone hole. They discuss the chemistry of the ozone formation. Students compare seasonal data collected with ozonesondes. They compare Antarctic and Arctic ozone hole...
Curated OER
Using GLOBE Data to Study the Earth System (College Level)
Students use the GLOBE Website to locate and study environmental data. They use the GLOBE Graphing Tool to display data. Students describe the role of solar energy in the annual fluctuations of soil moisture. They describe reservoirs and...
Curated OER
School Lighting Audit Data Analysis
Students analyze the data collected in the school lighting audit. They work together to write recommendations for more efficient lighting for their school. They practice using new vocabulary and working together with others.
Chicago Botanic Garden
Historical Climate Cycles
Scientists use ice core samples to obtain temperatures of the earth from 400,000 years ago! The third of five lessons instructs pupils to interpret historical climate data to see changes over time. In part I, participants interpret...
US Environmental Protection Agency
Weather and Climate: What's the Difference?
Future weather forecasters collect daily temperatures over a period of time. Afterward, they compare their data with monthly averages, as researched on national weather websites, in order to grasp the difference between weather and...
Berkshire Museum
Camouflage!: Collecting Data and Concealing Color
Help young scholars see the important role camouflage plays in the survival of animals with a fun science lesson. Starting with an outdoor activity, children take on the role of hungry birds as they search for worms represented by...
Chicago Botanic Garden
Climate Change Around the World
Look at climate change around the world using graphical representations and a hands-on learning simulation specified to particular cities around the world. Using an interactive website, young scientists follow the provided directions to...
Curated OER
Graphing Canada
Learners research a province of Canada choosing a question to investigate. They record their information on a worksheet that is provided and complete a graph. They present their bar graphs to the class.
Discovery Education
Sonar & Echolocation
A well-designed, comprehensive, and attractive slide show supports direct instruction on how sonar and echolocation work. Contained within the slides are links to interactive websites and instructions for using apps on a mobile device to...
Curated OER
Variables Affecting Earth's Albedo
Students study the variables that affect the Earth's albedo. In this environmental data analysis lesson plan students interpret and graph information and calculate changes.
Curated OER
Regents High School Examination: Living Environment 2005
The 2005 version of the Regents High School Examination in the area of ecology is as comprehensive as previous years' exams. It consists of 40 multiple choice questions on everything from the structure of DNA to the interactions within...
Curated OER
Sea Level Trends ~ Ocean Front Property: An "Immerging" Market
Young oceanographers take a look at sea level data from several cities over a few centuries. They use the data to fuel a discussion about what kind of changes are taking place and the impact they are having on the coastal ecosystems....
Curated OER
Ghostbusting in the Chesapeake
Ghost pots, fishing gear lost during crabbing expeditions, continue to trap crabs that are never collected. Increase your budding ecologists' awareness of human impact on the environment as well as conservation efforts using this...


