University of Minnesota
Memory Items
Ready to have an "unforgettable" time in science class? Try a fun and insightful activity, suitable for a wide age group of learners. Explore how human memory works when pupils try to remember objects they've seen before comparing the...
Curated OER
Using Current Data for Graphing Skills
Students graph demographic information. In this graphing activity, students choose what type of graph to create and what information to display. Links to examples of graphs and statistical data are provided. The graphs are created on the...
National Museum of Nuclear Science & History
Nuclear Popcorn
Make your lesson on radioactive decay pop with this lab exercise. Using popcorn kernels spread over a tabletop, participants pick up all of those that point toward the back of the room, that is, those that represent decayed atoms. As the...
Curated OER
Global Warming - The Heat is On: Global Climate Change Revisited
After listening to your lecture on climate change, young scientists access NOAA's database listing Mauna Loa's carbon dioxide data. They graph the monthly means and then compare their graphs to NOAA's. This is a concise plan that could...
Science 4 Inquiry
The Ups and Downs of Populations
As the reality of population decline across many species becomes real, pupils learn about the variables related to changes in populations. They complete a simulation of population changes and graph the results, then discuss limiting...
Curated OER
TE Activity: Bubbling Plants
Students study a way to quantify the process of photosynthesis during a given time using the Elodea plant. They design a hypothesis that they test in the hands on activity. They compare the amounts of photosynthesis that occur during low...
Curated OER
Just Me and My Shadow
Young scholars take measurements throughout the day using a simple sundial called a gnomon. They record the results on a Data Log and convert from English units to metric (S.I.) units. Data points are plotted on the same graph and analyzed.
Towson University
It's a Gassy World!
How much does your class know about the relationship between climate change and carbon dioxide? Science scholars explore the nature of greenhouse gases and rising ocean temperature through demonstrations, research, and experiments. The...
Centers for Disease Control and Prevention
Microbe Multiplication Magic
A lesson introduces the reproduction rate of E. coli though a video. Then scholars complete a data table and graph of reproduction rates in ideal conditions as well as less than ideal conditions.
Curated OER
Beans and Baleen
Predict whale populations using different beans as whales! Learners observe different types of beans in a dish knowing that each bean represents a different kind of whale. They then predict how many "whales" there are in a certain area....
BioEd Online
Good Stress for Your Body
Stress the importance of the different types of pressure our mind and body experience in a lesson about how certain types of stress are actually necessary and good for our bodies. As astronauts and people with injuries can attest, not...
Beyond Benign
The Heat Is On
Explore an exothermic reaction with a quick lab investigation. The activity builds on the previous lessons by examining an ingredient in many shampoos. Scholars record temperature data as sodium hydroxide and water interact.
Curated OER
Olympic Bar Graphs
For this Olympic bar graph worksheet, students pick a sport from the 2004 Olympic games and find data from the Olympic web page. They graph the scores (times, distance, or speed) and the medals. They answer questions about the variables...
Curated OER
Bar Graphs
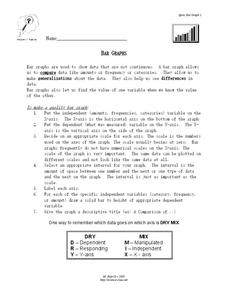
In this bar graph worksheet, students read about making quality bar graphs and they make a bar graph using given data. They answer 5 questions about their graph.
Curated OER
Graphing Predator/Prey Data
Learners use data from the Camouflage Game (played with red and green yarn caterpillars) to create a composite bar graph to display the collected data. They interpret the data and form a conclusion based on the graphs. Teachers may use...
Curated OER
A Tall Story
Students investigate the growth rate of a man named Bob Wadlow. In this growth rate of a man lesson, students determine if the growth rate of this particular man was normal or abnormal. Students bring in data of their height over time...
Curated OER
Analysis of the Concentration of Sodium Chloride in a Product
Students design an experiment to test for the concentration of chloride in products. In this analysis of chloride concentration lesson plan, students develop and conduct an experiment to find the amount of chloride ion in a substance of...
Curated OER
Exploring Wyoming Species Habitats
Students are introduced to the concept of species habitats and ranges. They introduced to ArcView GIS as a tool for mapping. Pupils use query data for species withina county, elevation, range, rivers and streams, land cover, and etc....
Curated OER
Trends of Snow Cover and Temperature in Alaska
Students gather historical snow cover and temperature data from the MY NASA DATA Web site. They compare this data to data gathered using ground measurements from the ALISON Web site for Shageluk Lake. They graph both sets of data and...
EngageNY
Tides, Sound Waves, and Stock Markets
Help pupils see the world through the eyes of a mathematician. As they examine tide patterns, sound waves, and stock market patterns using trigonometric functions, learners create scatter plots and write best-fit functions.
Curated OER
Wind Effects- A Case Study
Learners explore hurricanes. In this weather data interpretation lesson, students draw conclusions about the impact of Hurricane Floyd as it related to weather conditions. Learners read and interpret a tide data table, a barometric...
NOAA
A Matter of Density
Larvae transportation on the New England seamounts is based on the density of the water. Scholars calculate density and graph salinity versus temperature to better understand the distribution of organisms in a water column. Discussions...
Curated OER
That's Predictable - Stream Side Science
Research the impact that changes in biotic or abiotic factors might have on an ecosystem. Debate for or against the changes and take action in the community. This resource ideally follows stream studies that young ecologists may have...
Virginia Department of Education
Heat Transfer and Heat Capacity
It's time to increase the heat! Young chemists demonstrate heat transfer and heat capacity in an activity-packed lab, showing the transitions between solid, liquid, and gaseous phases of materials. Individuals plot data as the changes...


