Curated OER
Scientific Problem Solving
In this problem solving worksheet, students will conduct an experiment to answer this question: "How does watching too much television affect us?" Students will form a hypothesis, collect data, analyze their data, and draw a conclusion....
Curated OER
Conservation of Mass
In this conservation of mass worksheet, students design an investigation to demonstrate the Law of Conservation of Mass. Students describe their investigation, collect data, graph the data and write a conclusion about what they discovered.
Curated OER
Hurricane Frequency and Intensity
Students examine hurricanes. In this web-based meteorology lesson, students study the relationship between ocean temperature and hurricane intensity. They differentiate between intensity and frequency of hurricanes.
Curated OER
The Great MPA Debate
Students study the 'Marine Protected Areas' process. In this ocean lesson students work in groups, conduct research and present it to the class.
Curated OER
Is There Water on Mars?
Young scholars decide whether or not there is or has even been water on Mars. They analyze temperature and pressure data from the Pathfinder mission to Mars, and then they analyze images of Mars, interpreting the landforms they see and...
Curated OER
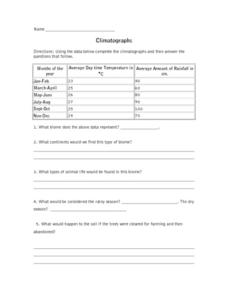
Climatographs
In this climatographs worksheet, young scholars are given 3 sets of data of the rainfall and temperature for 3 different biomes. Students identify the types of biome for each and answer questions about each. They make 2 graphs to compare...
Curated OER
Take Another Look
Seventh graders analyze different types of graphs and answer questions related to each. In this math lesson, 7th graders organize a given diagram to make it easier to interpret. They discuss why they made such changes.
Curated OER
Beans and Birds: A Natural Selection Simulation
Young scholars solve the following problem concerning the evolution of seed color in pinto bean plants: "How does natural selection change the frequency of genes or traits over many generations?" They use the constructivist approach to...
Curated OER
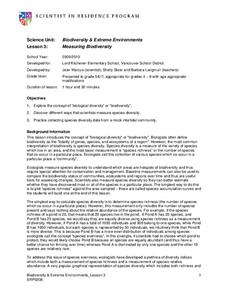
Measuring Biodiversity
Students collect species data from a mock intertidal community. In this biology lesson, students graph their data and analyze the species in it. They construct a species accumulation curve and present it to class.
Curated OER
Our Desert Backyard
Students make observations of their own backyard. In this environment lesson, students keep records of the plants and animals they see in their home or school yard. Students make notes of how the weather and environment changes over...
Curated OER
A Wet Welcome Home
Students investigate data collection and analysis. In this Algebra I lesson plan, students create a scatter plot and find the equation of best fit in a simulation of a leaking water pipe.
Curated OER
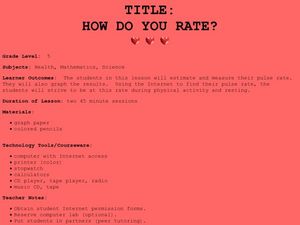
How Do You Rate?
Fifth graders make a graph. For this pulse rate lesson, 5th graders estimate their pulse and record it. Students measure their pulse while at rest and after physical activity and record it. Students use the internet to graph their...
Curated OER
Climate change in Canada
Students investigate the impact of human activity on the environment. In this secondary math/science lesson, students analyze and interpret information from data and graphs as they investigate trends in climate change and the reasons...
Curated OER
IT IS ABOUT SUPPLY AND DEMAND.
Students learn that the price of an item is defined by its supply and demand. In this lesson students graph the relationship between demand and supply of various products, students also consider hidden costs.
Curated OER
Science: Evidence for Global Warming
Young scholars examine the evidence for global warming and its causes. They analyze mean temperature data of a location for two twenty-year time periods (1891-1910 and 1981-2001). Students also assess atmospheric CO2 concentrations and...
Curated OER
Graphing Data Chart
In this fish data worksheet, students complete a graphic organizer by writing in the maximum length and maximum weight for 13 different fish.
Curated OER
Curious Clouds
Second graders explore clouds. They read The Cloud Book by Tomie dePola. Students sort the cloud pictures into three categories. Students create a graph using the cloud pictures. They use Excel to create a bar graph.
Curated OER
Ice Cream Lab
I scream, you scream, we all scream for ice cream! Even high schoolers enjoy making ice cream. This laboratory exercise has them record the temperature changes throughout the process of liquid becoming solid, graph the results, and...
Curated OER
Pizza Possibilities
Middle schoolers create and interpret line plots, bar graphs, and circle graphs. The lesson assumes mastery of conversions from fraction to decimal to percent, construction of angles, and at least an introduction to graphs displaying data.
Curated OER
And You Thought Gasoline Was Expensive!
Students carry out a cost analysis. For this comparative math lesson, students compare the cost of equal measures of gasoline to mouthwash, house paint, fruit juice, white-out, and other liquids.
Curated OER
Blast the Fats
Students examine the fats found in foods. In this nutrition lesson, students identify the types and amounts of fats found in foods as they research food labels and the Internet. Students classify the fats and record their data.
Curated OER
The Hudson's Ups and Downs
Even rivers have tides. Older elementary schoolers will discuss the Hudson River and how weather, water craft, and the ocean cause tidal fluctuation. They will examine a series of line graphs that depict tidal fluctuation, then analyze...
Curated OER
Time Management
Young scholars record their daily activities and graph the results using the educational software program called Inspiration. This lesson is intended for the upper-elementary classroom and includes resource links and activity extensions.
Curated OER
The Air Up There
Students observe the weather over a period of two weeks. They gather local weather data and calculate the mean and average figures from the data. They prepare a graph with their observations.


