Curated OER
FOLLOW THAT WATER
Students build simple stream tables and vary the angle of the stream tables in order to simulate different flow rates and compare the results. They observe various features formed in a stream table by flowing water and compare these to...
Curated OER
What Influences Reaction Rate?
Learners study reaction rates, what determines how fast a reaction happens and how the chemical changes occur. In this reactions lesson students complete a lab where they use Alka-Seltzer to observe reaction rate and create a graph with...
Curated OER
Measuring the Effect of Adrenaline on the Heart Rate of Zebra Fish
Students investigate the heart beat of zebra fish in timed intervals. They record the heart beats and average three counts to display in their data tables. They repeat these steps increasing the adrenaline solution.
Curated OER
Freshman Project-Part 6-Final Written Report
In this project worksheet, students complete a formal write up of their experiments. This includes a rationale, a purpose, a hypothesis, their experimental design, materials, procedure, data tables with variables, graphs and a concluding...
Curated OER
Is It There?
Students participate in a lesson designed to illustrate these concepts using simple materials. They use Science process skills to observe, measure, predict, make inferences, and communicate while completing the activity. Proper safety...
Curated OER
Waves
Light waves and sound waves are the focus of this science lesson designed for 5th graders. Besides discovering how these waves travel, learners also discover the basic properties of waves, and analyze data tables and graphs. The...
Curated OER
Rate and Concentration
Experimental data for a chemical reaction is available in a table. Chemistry cohorts use critical thinking skills to analyze the data and answer questions about reaction rates and reaction order. This worksheet is neatly formatted,...
Curated OER
Observations of Properties of Matter
To guide learners through observations of chemical samples in the lab, this resource asks them to give all formulas and complete the attached data sheet. There are multiple questions about categories of elements and general behavior,
Curated OER
Trends of Snow Cover and Temperature in Alaska
Students gather historical snow cover and temperature data from the MY NASA DATA Web site. They compare this data to data gathered using ground measurements from the ALISON Web site for Shageluk Lake. They graph both sets of data and...
Curated OER
Temperature and the Density of Air
Here is a hands-on activity in which junior scientists put air into a balloon to create a closed system. They measure its circumference, warm it in hot water, and then remeasure its circumference to discover how temperature affects the...
Curated OER
Basketball Bounces, Assessment Variation 2
This un-scaffold summative assessment tasks learners to use the height of a bouncing basketball, given the data in graph and table form, to choose the model that is represented. Learners then use the model to answer questions about the...
Curated OER
Basketball Bounces, Assessment Variation 1
This highly scaffolded, summative assessment tasks learners to choose the model that represents the height of a bouncing basketball given the data in graph and table form. Learners then use the model to answer questions about the...
Curated OER
Cosmic Chemistry: An Elemental Question
Space scientists investigate the cosmic phenomena in order to search for answers to possible origins of the solar system. They consider the concepts of elements and isotopes. Data is analyzed looking at tje abundance of elements...
Physics Classroom
Action at a Distance Lab
The concepts involved with static electricity are typically taught in upper elementary physical science units. The lab described in this resource has pupils examine the behavior of small pieces of paper and a balloon when a charged piece...
University of Colorado
Looking Inside Planets
Researchers use scientific data to understand what is inside each of the planets. The first in a series of six, this instructional activity builds off of that concept by having pupils use a data table to create their own scale models of...
Curated OER
A Closer look at Oil and Energy Consumption
Upper graders analyze basic concepts about the consumption, importation and exportation of the worlds oil production. They create several graphs to organize the data and draw conclusions about the overall use of oil in the world.
Curated OER
Shrinky Dinks® Palettes
Here is a fun and clever lesson for teaching physics classes how to calculate wavelength if given the energy and frequency data. On a worksheet, they compute wavelengths using a table of information that you provide. On a paper palette,...
Curated OER
Discovering Density
If you have a set of six various metal rods, you can use this lab activity to challenge science students to calculate their densities. They will use a triple beam balance to measure the mass and the micrometer and ruler determine the...
It's About Time
Sounds in Strings
How many of your pupils play an instrument? A musical science lesson will help all of them understand how string instruments work. Young scientists construct a string-and-pulley system to test frequency and pitch. The lesson ends with a...
Curated OER
Comparing Pulse Rates
Young scholars participate in a lab that demonstrate one example of how the human body maintains homeostasis. Students collect data from themselves and observe how their own bodies react to exercise.
Curated OER
A Research Project and Article For the Natural Inquirer
Get your class to use the scientific process to solve a scientific problem. They utilize the Natural Inquirer magazine to identify a research question which they write an introduction to and collect data to answer. They use graphs,...
Cornell University
Math Is Malleable?
Learn about polymers while playing with shrinky dinks. Young scholars create a shrinky dink design, bake it, and then record the area, volume, and thickness over time. They model the data using a graph and highlight the key features of...
Curated OER
# 21 Measuring Nitrate by Cadmium Reduction
Students design an experiment to evaluate the effects of various treatments on the nitrogen cycle in a freshwater aquarium. They are required to maintain a laboratory notebook of all work, measure the key analytes of the biosystem at...
Curated OER
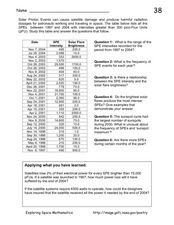
Solar Proton Events
On this worksheet, space scientists use a data table to answer questions about the relationship between the brightness of solar flares and the intensity of the solar proton events. They apply what they learned from the data to address...


