Curated OER
Shoe Classification Lab
Students use shoes to make a classification flow chart. In this classification lesson plan, students all take one of their shoes off and put it on a table. In groups they create a classification system based on 3 characteristics of the...
Curated OER
Using technology to engage students in science through inquiry research
Students study animals and their behaviors. For this animal behavior lesson students divide into groups and collect data and research animal behaviors.
National Security Agency
Are You Ready to Call the Guinness Book of Records?
Learners design questions that can be answered by collecting data. In this line-plot lesson, pupils collect data and graph on a line plot on world records. An abundant supply of teacher support is provided in this resource.
Virginia Department of Education
Metals, Nonmetals, and Metalloids
How can one easily classify metals, nonmetals, and metalloids? Pupils answer this question as they experiment with unknown substances and perform tests on conductivity, brittleness, and malleability to determine which unknown belongs in...
University of Georgia
What's So Special about Bottled Drinking Water?
Is artesian water designed to be better, or is it just from wells similar to those in the city of Artesium? This experiment looks at many different types of bottled waters, including artesian. Using a soap mixture, scholars test to see...
Curated OER
Genetics
Trace simple genetic patterns of inheritance through a small population. Your students create a family pedigree that traces a genetic condition through several generations.
Virginia Department of Education
Matter and Energy: Equations and Formulas
Using simple materials, an informative lesson demonstrates the Law of Conservation of Matter and explains how to balance chemical equations. Young chemists perform experiments, analyze reactions, and balance chemical equations on their...
Curated OER
Add and Subtract with Hudson River shipping
Rivers aren't just a place for animals to live, they also provide industrial transportation. The class will examine the Hudson River on a map, discuss all the commercial vessels that use the River to transport materials, then complete a...
Curated OER
Periodic Table & Its Trends-Day 6
Students intergrate science, technology and society into exploring the periodic table. They investigate one element of their choice and write a one page paper on the elements discovery, properties, uses, and the effect on society.
Curated OER
Creating a Thematic Map Using S'COOL Data
Students observe weather patterns, collect data, and make a weather predictions for various locations on a map.
Curated OER
The Accuracy of Climate Data
Students use maps to determine how accurate climate data really is. They also answer questions using a table of data.
Curated OER
The Statistical Nature of Test Data
Students investigate the properties of various metals. They conduct an experiment and gather the data by putting into the proper statistical graphs. The data is analyzed and conclusions are formed according to the properties of the metals.
Virginia Department of Education
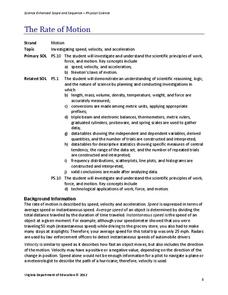
The Rate of Motion
How much time does it take to jump over three balloons? Pupils calculate the speed of tasks that require different motions. They determine motions for tasks such as walking, skipping, hopping, and jumping before creating a spreadsheet...
Virginia Department of Education
Heat and Thermal Energy Transfer
How does radiation affect our daily lives? Answer that question and others with a lesson that discusses radiation and its use in thermal energy transfer through electromagnetic waves. Pupils investigate vaporization and evaporation while...
Virginia Department of Education
Light and the Electromagnetic Spectrum
Lead your class in a fun-filled team activity that encourages collaboration while learning important concepts. Pupils actively participate in a discussion on the experimental design and the role of mirrors. They perform group activities...
Virginia Department of Education
States and Forms of Energy
Energy is just energy, right? Explain various forms of energy to your young scientists by using an interactive experiment that contains common objects to demonstrate complex concepts. Pupils conduct experiments for radiant, thermal,...
University of Wisconsin
Follow the Drop
Young surveyors look for patterns in water flow around campus. Using a map of the school (that you will need to create), they mark the direction of the path of water. They also perform calculations for the volume that becomes runoff. The...
Nuffield Foundation
Effect of Size on Uptake by Diffusion
Cell size is limited by the surface area to volume ratio, but why is this true? Scholars measure the surface area and volume of cubes before placing them into liquid. After a set amount of time, they measure the uptake by diffusion for...
Curated OER
Lifting a Load
Students experiments with levers to determine if the amount of force needed to lift a load is always the same. For this physics lesson, students use Lab-Pro data collector as they experiment with the fulcrum placement to measure the work...
Curated OER
How Texas is Planning To Manage Its Water
Students research water management strategies in Texas. They analyze projected demand for water in the year 2050, interpret graphs and tables and then discuss the data as part of a written report. They research and map the locations of...
Curated OER
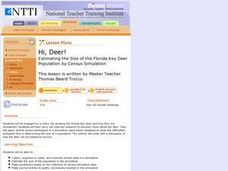
Hi, Deer!
Students collect, organize by table, and examine census data in a simulation, estimate the size of the population in the simulation and make predictions based on the collection of census simulation data.
Curated OER
Differences between Climate and Weather
Students collect weather data over weeks, graph temperature data and compare the temperature data collected with averaged climate data where they live.
Curated OER
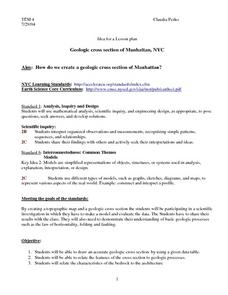
Geologic cross section of Manhattan, NYC
Students draw an accurate geologic cross section by using a given data table. They relate the features of the cross section to geologic processes. Students then relate the characteristics of the bedrock to the architecture.
Curated OER
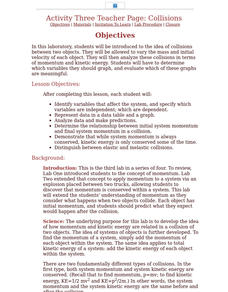
Activity Three Teacher Page: Collisions
Students after completing this lesson, identify variables that affect the system, and specify which variables are independent; which are dependent. They represent data in a data table and a graph and analyze data and make predictions.


