Curated OER
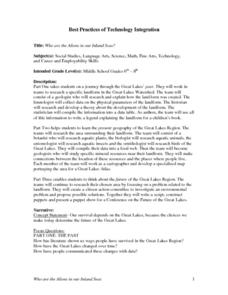
Who Are the Aliens in Our Inland Seas?
Students work in teams to research specific landforms in Great Lakes Watershed, compile information into data table, and write legend explaining landform for children's book. Students then research area surrounding landform, compile...
Curated OER
Asthma Survey
Learners collect survey data on the prevalence of asthma in a community. They summarize and display the survey data in ways that show meaning.
Curated OER
Making Sounds
Students perform three experiments to gain understanding of how pitch changes. In this sound lesson, students create a variety of sounds with different pitches. Students will record their data as the observe the differences in the sounds...
Curated OER
Fizzy Pop
Fifth graders compare and identify variables that affect the rate of a chemical change using Alka-Seltzer, water, ice, and hot water. They time how long each variable takes to pop the canister into the air, and record the results on a...
Curated OER
Dig Into Soil
Young scholars discuss what is found in soil. In this science lesson plan, students observe the soil outside and write down information in regards to location, vegetation, and topography. Young scholars experiment with the soil and its...
Curated OER
When the Snow is as High as an Elephant
High schoolers study the concept of mean values using a data plot. Learners enter the given data in the activity to create their data table. They use the data table to calculate the mean of the snowfall percentage provided in the...
Curated OER
The Lynx Eats The Hare
Students investigate the predator and prey relationship. This is done using a simple simulation. The simulation is done as an arts and craft activity. Students record data and track it using a graphic organizer and then they discuss the...
Curated OER
Ocean Currents and Sea Surface Temperature
Students use satellite data to explore sea surface temperature. They explore the relationship between the rotation of the Earth, the path of ocean current and air pressure centers. After studying maps of sea surface temperature and ocean...
Curated OER
Take a Walk
Sixth graders graph acceleration and practice using the metric system. In this physics lesson, 6th graders take turns timing each other as they walk 15 meters. Students then chart and graph their data using the metric system.
Curated OER
Mapping The Ocean Floor
Young scholars explore and analyze the bottom structure of underwater habitats. They describe and explain what can't see through the collection and correlation of accurate data. Learners assess that technology is utilized as a tool for...
Curated OER
Conditions at Sea Introductory Activity, Making Waves
Students explore waves and wind. In this physical and earth science wave instructional activity, students participate in a wave making activity with an aquarium and a hair dryer. Students complete a data chart recording wave height and...
Curated OER
What's A Water Column Profile?
Learners investigate water column data. In this earth science and seawater instructional activity, students determine how temperature, salinity, and density have an impact on sea water by viewing and analyzing data obtained from a number...
Curated OER
Global Warming Statistics
Learners research and collect data regarding temperature changes for a specific location and find the mean, median, and mode for their data. In this climate change lesson plan, students choose a location to research and collect data...
Curated OER
Observing and Sketching the Lunar Surface
Students explore space science by conducting an illustration activity. For this lunar lesson, students discuss what the moon is and the role it plays for our environment on Earth. Students view images of the moon and utilize chalk to...
Curated OER
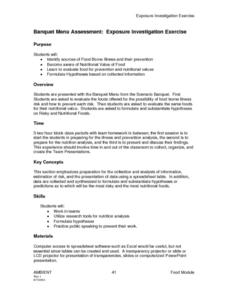
Banquet Menu Assessment: Exposure Investigation Exercise
Learners identify sources of Food Borne illness and their prevention. They formulate hypotheses based on collected information. Pupils become aware of Nutrintional value of food. Students collected data are synthesized to formulate...
Curated OER
Specific Heat of Air and Soil
Students are introduced to the concept of specific heat. In groups, they are given a set of data showing the temperatures of air and soil samples in which they calculate the ranges of the data. They identify whether the air or soil...
Curated OER
Cities and Seasons
Students explore how satellite images show seasonal changes in seven cities in North and South America. Through a sequence of images, they study the green-up and brown-down of the seasons and how seasons change over time. Afterwards,...
Curated OER
Heating The Atmosphere
In this science worksheet, students look for the answers to finding the correct temperatures that match the location in the atmosphere.
Curated OER
Inclined Plane and Pulley
Learners describe how inclined plane and pulleys make work easier. In this physics lesson, students calculate work done and mechanical advantage of both simple machines. They collect data from the experiment and construct graphs.
Curated OER
Creating an Enzyme-Substrate Model
Students explore the reaction rates of an enzyme-mediated reaction through experimentation. In small groups, they use everyday objects to demonstrate the effects of environmental variables on enzyme function.
Students graph and...
Curated OER
How Do We Solve the Problem of Wildlife on Our Roads?
Students analyze data on elk ecology and movements across the highway. In this ecology lesson, students research ways to save them from highway collisions. They write a report and present their findings in class.
Curated OER
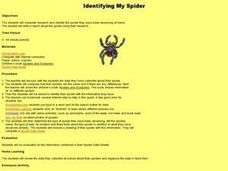
Identifying My Spider
Third graders navigate the Internet and research spiders. In this spider instructional activity, 3rd graders view photos of spiders and use their characteristics to determine the variety of spider. Students complete a spider data sheet.
Curated OER
Explore Your Natural Habitat
Students identify habitats and understand why they are important to our environment. In this environmental lesson students design their own habitat, observe and record data on the impact their habitat has on the environment.
Curated OER
Energy and Changes of State
Students complete a variety of labs to help them explain how energy affects the changes in states of matter. They also be required to collect and record data, graph data, and apply interpretations of that data.


