Curated OER
Respiration
This series opens with diagrams of experimental setups. A data table is displayed and questions are asked, indicating that the intent is for lab groups to perform the depicted experiments. At slide twelve, a coherent lesson about the...
Curated OER
Displacement vs. Distance Worksheet
Displacement is a foundational concept for physics pupils. If they are having trouble discerning it from distance, this activity can help clear things up. The first page is essentially a piece of graph paper. It has a compass rose and a...
Curated OER
Elastic Recoil in Arteries and Veins
A lab in which high schoolers examine the difference between arteries and veins. Budding biologists will find out which blood vessel can stretch furthest, recording their data in a table then answering several questions evaluating their...
Adrian College
The Universe
Young scientists create a simulation of Hubble's law. Introducing the Big Bang Theory using balloons and a simple lab worksheet, scholars complete a data table and perform analysis.
Royal Society of Chemistry
Esters from Alcohols and Acids
Fats and oils often contain esters, which sometimes find their way into perfumes due to their pleasant smells. Scholars match the name of esters made from four different types of alcohol and four different types of carboxylic acids....
Royal Society of Chemistry
Shapes of Molecules—Hybrid Orbitals
Take your chemistry class' knowledge of molecular geometry to the next level! Introduce orbital hybridization with a series of related games. Individuals complete a data table in the first activity, then solve Sudoku-like puzzles using...
Curated OER
First Class First? Using Data to Explore the Tragedy of the Titanic
Students analyze and interpret data related to the crew and passengers of the Titanic. They research information on a Titanic database to illustrate specific statistical conclusions, and whether or not social status affected the outcome.
Curated OER
Experiment Report
In this experimental design activity, learners fill out their title, hypothesis, independent and dependent variables, data table, graph and conclusion for their lab.
Curated OER
Pendulum Lab in 9th Grade Physical Science
Ninth graders conduct experiments to determine what affects the rate of a pendulum's swing. Working in small groups, they identify an independent variable to study and create an experiment to test their hypothesis. When tests are...
University of Washington
Toothpick Fish
With colored toothpicks representing genes, youngsters practice passing them through generations of fish and learn about heredity. Consider this as an introductory activity since it does not represent recessive genes with lowercase...
Curated OER
Where Are the Bugs?
Students trap, collect and identify arthropods in a newly created desert tortoise preserve area over a period of one school year. They determine the rate at which various arthropods take up residence in the newly landscaped area. Data is...
Oregon State
Using Paper Chromatography
Through the analysis of paper chromatography to separate ink from the pen found at the crime scene, learners analyze the different stains and through calculations determine the thief.
American Chemical Society
Using Color to See How Liquids Combine
Blue-tinted water is added to unknown liquids that have been tinted yellow to find out how they interact. This is a memorable activity that is part of an investigation on the properties of liquids, which is part of a unit on the...
Curated OER
Starch and Sugar Testing 1
Eighth graders determine the presence of starch and sugar in unknown solutions. This task assesses students' abilities to observe, record and interpret data, classify, generalize/infer, construct data tables, and identify sugar and...
Curated OER
The Periodic Table
Students research an assigned element using the library, an encyclopedia, the Internet and other appropriate resources in order to write a research paper, a project, and an oral presentation.
Curated OER
Burning Snacks in Chem Lab
Students determine the energy content of various snack foods. They measure the temperature changes in various snack foods as the foods are burned in order to determine the foods' energy content. Students create graphs and data tables of...
Curated OER
The Periodic Table
Eleventh graders examine the history and development of the periodic table and properties of elements. They complete worksheets, take notes during a teacher-led discussion, and produce their own periodic table.
Curated OER
Nine Examples for Tables, Pictographs, Mean. Median, and Mode
In this graphical representation of data and measures of central tendency worksheet, students calculate mean, median, and mode and answer questions related to graphs, tables, and pictographs.
Curated OER
Sweethearts and Data Analysis
Learners explore the concept collecting and representing data. In this collecting and representing data lesson, students record the different colors of sweetheart candies in their sweethearts box. Learners create a table of the data and...
Curated OER
Using Current Data for Graphing Skills
Students graph demographic information. In this graphing activity, students choose what type of graph to create and what information to display. Links to examples of graphs and statistical data are provided. The graphs are created on the...
Curated OER
Modeling Earthquake Data
Young scholars evalute evolutionary theories and processe of Geology. They examine evidence that the movement of continents has had signicicant global impact, major geological events. Students evaluate the forces which shape the...
Inside Mathematics
Winning Spinners
Winning a spin game is random chance, right? Pupils create a table to determine the sample space of spinning two spinners. Individuals determine the probability of winning a game and then modify the spinners to increase the probability...
Shodor Education Foundation
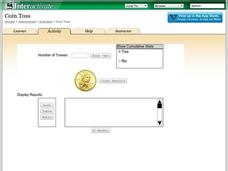
Coin Toss
Are your young mathematicians having a hard time making heads or tails of probabilities? It's no toss up—here is a resource that's sure to straighten them out! Learners run the interactive to toss a coin a different number of times....
NASA
Launch Altitude Tracker
Using PVC pipe and aquarium tubing, build an altitude tracker. Pupils then use the altitude tracker, along with a tangent table, to calculate the altitude of a launched rocket using the included data collection sheet.


