Curated OER
It'll Go With the Flow...
Students construct a water table elevation contour map and consider the direction and rate of groundwater flow to predict the actual runoff pattern. They discuss their findings and evaluate a hypothetical landfill site based on data...
Curated OER
Genetic Drift
Students use a mathematical simulation of genetic drift to answer questions about the factors that influence this evolutionary process. They run a series of simulations varying allele frequency and population size and then analyze their...
Curated OER
History of Rock
Students study a specific type of rock then share that expertise with other students in small groups. They view a rock and write observations about the rock to form small groups. In addition, they present their rocks an obervations to...
Curated OER
Volcano Hazards
Students research volcano hazards in VolcanoWorld, make a paper volcano, produce and watch the effects of ashfall, produce and watch the effects of a mudflow and create a hazard map by plotting historical ashfall/mudflow data from Mount...
Curated OER
Beginning Statistical Inquiries into the Scientific Method: Jelly-Side-Down
Students describe what happens when a piece of jellied toast is dropped off a table. From these observations, students pose a question concerning which side of the jellied toast land on the floor.
Curated OER
You Light Up My Life
Students examine the relationship between solar activity and the Earth's geomagnetic field in producing the phenomena known as aurora borealis (Northern Lights) by reading and discussing "Earth, Wind and Fireworks." students graph data...
Curated OER
How Do Populations Grow?
Students examine how populations grow and how invasive species can affect the balance of ecosystems. They simulate the growth of lily pads, analyze and record the data, and simulate the results of an invasive species on an ecosystem.
Curated OER
Teaching Radioactive Decay: Radioactive Half-life And Dating Techniques
Students generate a radioactive decay table for an imaginary element using a box filled with pinto beans and M&M's. They use their data to plot a decay graph, develop the concept of half-life, and use the graph to "age" several samples.
Curated OER
What's in the Water?
Fifth graders use the dots to simulate water pollutants in a lake. They use cups to collect a sample of "water." Students sort the dots by color and record the number of each dot color under the correct pollutant name in the Lake Water...
Curated OER
What on Earth is a Biome?
Students explore organisms and their environments. They examine change over time
demonstrate an understanding of physical positions on Earth. They survey earth's diversity, write a report, fill in a data table created on the...
Curated OER
Experiment on Measuring Reaction Rates
High schoolers investigate the rate of a chemical reaction. In this rate of reactions lesson plan, students use an electronic balance to measure the change in mass of a chemical reaction between hydrochloric acid and calcium carbonate....
Curated OER
Give Me Some Sugar, Honey!
Students research the history of honey and different products that come from honey. In this bees and honey activity, students review how honey is made, discuss ways people use honey, research the history of honey and its uses, create a...
Curated OER
The Conservation Of Mass (The Mass Of Gas)
Middle schoolers gain an understanding of matter in all of its phases. In this science lesson plan, students further their knowledge of the laws of conservation of mass, the loss in mass can be accounted for, when the gas is allowed to...
Curated OER
Mapping Exercise
In this mapping worksheet, students are given data of children exposed to health risks and their geographical location. Students plot each child's home and the risk factors using an (x, y) grid. They answer 2 questions about the...
Curated OER
Healthy Water!?
Students test water for its quality and record their information.In this water quality activity, students investigate water for pH, macro invertebrates and identify its characteristics. Students complete worksheets on their data for...
Curated OER
Cardiovascular Disease and Fitness: Exploring the Rhythm of Your Pulse
Students explore several examples of cardiovascular diseases. In this anatomy lesson, students explain why physical fitness is very important. They count their pulse rate and record them on a data table.
Curated OER
Take the Pulse of Your Classroom
Students discuss seismic waves. In this science lesson, students investigate the acceleration of the floor in the classroom similar to a seismograph. Students observe a three-component seismogram from an earthquake and determine what it...
Curated OER
Volume of Gas
Eighth graders investigate the effect of temperature on the volume of a gas in a closed container. They measure the height of the water in their beaker/container, conduct their experiment, and create a graph to illustrate their data.
Curated OER
E. coli and Their Human Environment
High schoolers are able to observe how environmental changes (antibiotics) affect the growth of E. coli. They are able to use the "F" test for statistical analysis. Students can explain that E. coli is a common rod-shaped intestinal...
Curated OER
Density Lab
Students find the density of two substances. In this density lesson plan, students determine the density of water and ethyl alcohol and compare their densities. They enter their data into the computer to produce a class compiled graph....
Curated OER
Counting Animal Populations
Students learn how to count animal populations by the Mark and Recapture method. In this counting animal populations lesson plan, students begin by predicting amounts of different candies in a jar. Students then simulate using beans, two...
Curated OER
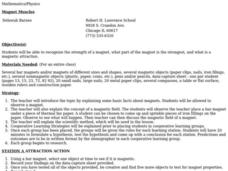
Magnet Muscles
Students experiment with magnetism. In this science instructional activity, students are divided into cooperative learning groups and use the scientific method to test their hypothesis. Each group performs a different experiment.
Curated OER
What's the Matter? (Grade 3)
Third graders organize information about the three types of matter and to reinforce concepts learned in the matter unit of the science curriculum. They use Inspiration software to create a concept map of the three types of matter.
Curated OER
Projectile Motion
Students observe projectile motion and calculate the speed of a baseball based on the time and distance traveled. They record the time, measure the distance, and draw the path of the ball's travel on a data table.


