Curated OER
Periodic Table Notes: Determining # of Shells and Valence Electrons
Although the directions say to view a PowerPoint, it is not necessary in order to complete this assignment. Six fill in the blank questions survey the periodic table of elements. A chart follows in which, given the element symbol, young...
Howard Hughes Medical Institute
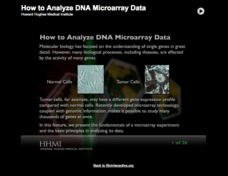
How to Analyze DNA Microarray Data
Unravel the complexities of DNA research. Analyzing DNA data can be a daunting, time-consuming task; however, as the lesson explains, an interactive importance of the research outweighs its complexities. The presentation breaks down the...
Curated OER
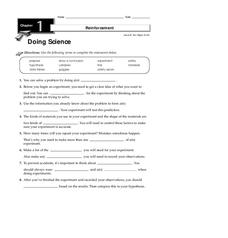
Doing Science
In this science experiment process worksheet, students will learn about the steps of conducting a science experiment, including creating a hypothesis, collecting data and drawing a conclusion. This worksheet has 8 fill in the blank...
Curated OER
Food chains at sea
Fifth graders interpret a table of data about food chains in the ocean. They create a food chain to represent the information on the table. Periwinkles eat seaweed, and crabs eat periwinkles - so who eats crabs? Extend the activity with...
Curated OER
Physical Science: Festival of Bubbles
Investigate bubbles through the use of scientific inquiry. Pupils blow bubbles using several methods and measure the resulting bubble print. Measurements are recorded on a data table and transferred to a bar graph. Results are discussed...
University of Texas
Matter and the Periodic Table Chemical Families and Periodic Trends
Is assembling the periodic table as simple as Tetris? Scholars arrange colored cards into a logical order and then make connections to the arrangement of the periodic table. Hands-on activities include adding trend arrows and analyzing...
Howard Hughes Medical Institute
Survival of the Fittest - Variations in the Clam Species Clamys sweetus
It's not often that you come across a clever laboratory activity that is both imaginative and comprehensive! Using M&M's and Reese's peanut butter candies to represent two different clam species, young biologists test for "relative...
Code.org
Rapid Research – Data Innovations
Scholars conduct research into a computing innovation of their choice and figure out how it uses data. They prepare brief reports of their research in the second installment of the series.
Chicago Botanic Garden
Historical Climate Cycles
What better way to make predictions about future weather and climate patterns than with actual climate data from the past? Young climatologists analyze data from 400,000 to 10,000 years ago to determine if climate has changed over time....
Curated OER
"Lettuce" Learn About the Water Cycle
Young scientists investigate the water cycle through a lettuce seed experiment. For this experiment, learners plant lettuce seeds inside of a ziplock bag in order to create a small greenhouse. They observe condensation and precipitation,...
Curated OER
What is the Nature of Science?
Conduct a survey about the nature of science with your high schoolers. They will record their responses in a table and then discuss the implications of scientific theory. Note: There are activity sheets, and forms included with this...
Education Development Center
Creating a Polynomial Function to Fit a Table
Discover relationships between linear and nonlinear functions. Initially, a set of data seems linear, but upon further exploration, pupils realize the data can model an infinite number of functions. Scholars use multiple representations...
Consortium for Ocean Leadership
Nannofossils Reveal Seafloor Spreading Truth
Spread the word about seafloor spreading! Junior geologists prove Albert Wegener right in an activity that combines data analysis and deep ocean exploration. Learners analyze and graph fossil sample data taken from sites along the...
Curated OER
To Recycle, or Not Recycle?
To recycle or not to recycle, that is the question. Your class can find the answer by taking a teacher created WebQuest, where they assume a role of a community member taking a stand on implementing a community wide recycling plan. The...
Curated OER
Environmental Agents of Mathematics: Mathematics for Change
High schoolers analyze environmental science data using Math. They do research about renewable energy, gather data, create graphs and interpret their findings. Then the group presents their arguments persuasively using their findings to...
Curated OER
Where Did the Bunny Leave the Eggs? Picture Graphing Activity
The Easter Bunny left us a bunch of eggs, but how many did he leave? Learners use the data to create a picture graph, interpret it, and answer the questions that follow. There's even easy egg cut-outs for your youngsters!
Curated OER
Now That's Using Your Head!
Explore linear measurement. Scholars will measure the circumference of their head and the distance they can jump. Information is recorded, averages are calculated, and a data table is completed. They then determine possible relationships...
Magic of Physics
Shadows
Sunrise, sunset ... swiftly move the shadows! Pupils practice comparing shadow length data with a hands-on activity. The resource allows users to examine and measure the shadow cast by a stick as the sun moves overhead before testing...
Curated OER
Making and Interpreting Tables
In this data tables worksheet, students make and interpret data tables given data about magazine sales. They categorize their data, complete their data table and answer questions about their data.
US Environmental Protection Agency
Carbon Through the Seasons
Meteorologists view an animated video by the Environmental Protection Agency to learn how the carbon cycle works, and then move into groups to analyze and graph actual data of the atmospheric carbon dioxide concentration from Hawaii's...
Curated OER
What's in a Graph?
How many yellow Skittles® come in a fun-size package? Use candy color data to construct a bar graph and a pie chart. Pupils analyze bar graphs of real-life data on the Texas and Massachusetts populations. As an assessment at the end of...
NOAA
Importance of Deep-Sea Ecosystems – How Diverse is That?
When judging diversity of an ecosystem, both species evenness and species richness must contribute. After a discussion of diversity and a guided example using the Shannon-Weaver function, scholars use the same function on two other...
Statistics Education Web
Are Female Hurricanes Deadlier than Male Hurricanes?
The battle of the sexes? Scholars first examine data on hurricane-related deaths and create graphical displays. They then use the data and displays to consider whether hurricanes with female names result in more deaths than hurricanes...
Pingry School
Heat of Reaction and Hess's Law
Melting and burning might seem like opposites, but both exist as common examples of exothermic reactions. Scholars work with three different exothermic chemical reactions to determine the enthalpy changes. They measure and mix chemicals,...


