SRI International
The Water Crisis
Water, water, everywhere, right? Wrong. Learners assess their own knowledge of water availability on Earth. Then, through a reading, a teacher-led presentation, and an activity, pupils learn about the importance of available clean...
Kenan Fellows
Isotopic Pennies
Many people confuse atomic mass and atomic numbers. The sixth of seven lessons in a unit requires scholars to find the weight of different groups of pennies. Then, they must solve how many of each type of penny exists in a closed system...
Pingry School
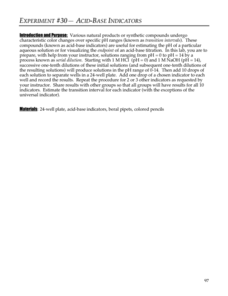
Acid-Base Indicators
Acid-base indicators are an essential part of any chemistry classroom. Individuals explore the color-changing feature of the important indicators in a vibrant hands-on activity. Using serial dilution, learners create solutions ranging...
Wild BC
Bearly Any Ice
After reviewing food chains, your class members participate in an arctic predator-prey game that exemplifies the impact of climate change of food availability. If you are in a hurry, skip this lesson, but if you have the time to...
Beyond Benign
Catalysts and Oxygen
Here is an engaging and hands-on lesson plan that allows high school chemists to demonstrate the effects of a catalyst on various chemicals. They garner knowledge of how reactants and products differ from one another, while analyzing the...
Chymist
Plop, Plop, Fizz, Fizz
One of the most recognizable commercial melodies was written in 1977, and led to gastronomical relief around the world. Scholars use Alka Seltzer tablets to measure reactants and calculate the chemical equation for the reaction of NaHCO3...
Mathematics Assessment Project
College and Career Readiness Mathematics Test C1
Challenge high schoolers with a thorough math resource. The 20-page test incorporates questions from upper-level high school math in applied and higher order questions.
NASA
Development of a Model: Analyzing Elemental Abundance
How do scientists identify which elements originate from meteorites? Scholars learn about a sample of material found in a remote location, analyzing the sample to determine if it might be from Earth or not. They study elements, isotopes,...
NASA
Christa's Lost Lesson: Effervescence
How are chemical reactions affected by gravity? Learners explore the phenomenon of effervescence as part of the Christa's Lost Lessons series. They compare findings in an experiment on effervescence to a video of a similar experiment in...
Space Awareness
Star in a Box
What happens to stars as they get older? A simulation takes pupils through the life cycle of stars based on their masses. The resource introduces the Hertzsprung-Russell diagram and the common relationships and life cycle patterns observed.
Biology Junction
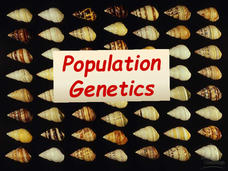
Population Genetics
Genetic variation shows the health of a population, yet cheetahs show very little variation over that last 10,000 years. Scholars learn the importance of genetic variation in populations after viewing an informative presentation. It...
Polar Trec
Plankton Parents
Plankton are so abundant in the ocean they outweigh all of the animals in the sea. In this three day activity, groups discuss and become familiar with plankton, capture females, and look for egg production on day three.
Curated OER
The Periodic Table of Elements
In this chemistry learning exercise, students identify and locate vocabulary terms related to the Periodic Table of Elements. There are 18 words located in the puzzle.
Curated OER
Elements of the Periodic Table
In this chemistry worksheet, students identify and locate various vocabulary terms relating to the elements found in the periodic table. There are 116 chemistry terms located in the word search.
Curated OER
Science Puzzle
In this science worksheet, students identify and locate vocabulary words related to various sciences. There are 20 words located in the word search.
Curated OER
Peat Pots
Students place a peat pot in water to observe and calculate the rate of capillarity in a model of a soil. This task assesses students' abilities to make simple observations, collect, record, and represent data, use a data table to...
Curated OER
Mapping River Statistics
Students research different statistics to do with the Mississippi River. They answer questions about finding data and collect it by conducting research. The research is used to construct a data table. Then students use the table to...
Curated OER
Bird Feeding and Migration Observation
Students research bird migration and build a bird house. In this bird lesson plan, students research the birds in their area and where they migrate to. They also build their own bird house and record data on what kinds of birds come to...
Curated OER
Iron Oxide Lab: Incorporating Math and Science
Students conduct an experiment in small groups, draw conclusions about the amount heat of a compound achieves and practice their data analysis skills.
Curated OER
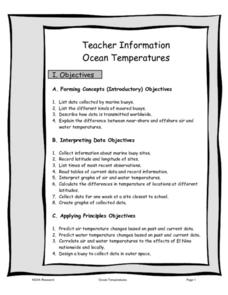
Ocean Temperatures
Students list data collected by marine buoys and the different kinds of moored buoys. They describe how data is transmitted worldwide. They explain the difference between near shore and offshore air and water temperatures.
Curated OER
Impact!!
Students perform a science experiment. In this algebra lesson, students collect data from their experiment and create a graph. They analyze the graph and draw conclusion.
Curated OER
My Peanut Butter is Better Than Yours!
Students explore the concept of statistical data. In this statistical data lesson, students read an article about the dangers of peanut butter to those who are allergic. Students perform a taste test of two different brands of peanut...
Curated OER
Squares in the Light
Students collect and analyze data using a graph. In this algebra lesson, students explain their findings orally and with a graph. They use their knowledge to solve real life scenarios.
Curated OER
Saving Energy Through Ecological Landscape Design
Students are able to transcribe to scale the plant features of a common landscape. They determine true north and south and collect and record data on a table. Students calculate a rating for and describe a definition of insulation and...


