Curated OER
It's 'ELEMENT' ary
Middle schoolers, using a Web site about the periodic table of elements, create spreadsheets representing elements and their properties. They also create graphs that compare the physical properties of the elements.
Curated OER
Probing Under the Surface
Eighth graders use a measuring stick to determine the shape of the inside of the bottom of a box, then apply their knowledge to an additional situation. This task assesses students' abilities to make simple observations, collect and...
Curated OER
Bluebirds Project
In this bluebirds project worksheet, students are given directions on completing a project about bluebirds including measurements, scientific method questions, data entry, and more. Students complete 15 exercises.
Curated OER
Periodic Trends
Students explore the rationale behind the arrangement of the elements on the Periodic Table. Using internet and traditional research, students compare and contrast the properties of elements on the periodic table to determine a...
Curated OER
Compare and Contrast Culture
Fifth graders compare and contrast the cultures of American culture with that of the other cultures of North America. Using traditional and Internet research, 5th graders gather data on one element of culture for comparison. Data...
Curated OER
Motion on an Inclined Plane
In this physics worksheet, students model the acceleration, velocity, and position of a cart moving up an inclined plane. They take data and determine a pattern in the data. Students also describe their findings and create an illustration.
Curated OER
Power Metering Project
High schoolers collect and analyze variable data and understand the concept of electrical power. In this energy lesson students use a spreadsheet to manage their data and create box plots.
Curated OER
Effects of Temperature, Deviation on Climate
Young scholars collect and record data for a given city. They calculate standard deviation of temperature and analyze the impact of climate changes on a city's and culture.
Curated OER
Weather Station Report
In this science worksheet, middle schoolers fill out the data report for the seven different questions. The focus is upon the interpretation of data.
Curated OER
Monitoring River Levels
For this environmental science worksheet, learners read and study water maps from an interactive website to complete 8 short answer questions that follow.
Curated OER
Melting Points of Elements in Period 3
For this elements worksheet, students use a data table to graph the elements and their melting points. Students have 8 elements to graph.
Curated OER
Parts of Lab Report Review Sheet
In this lab report worksheet, students answer ten questions by filling in a blank with the appropriate letter that corresponds to the part of the lab. Students determine where data goes, where observations go, where answers to discussion...
Curated OER
Graphing Sea Ice Extent in the Arctic and Antarctic
Students graph sea ice data and predict long term trends in the data. In this climate change lesson, students use sea ice data from the Arctic and Antarctic to construct line graphs. They use their graphs to predict the effects of global...
Curated OER
Climate Change
Students compare weather data and draw conclusions. In this climate change lesson plan, students determine whether data collected over a period of ninety years shows a warming trend.
Curated OER
An Inventory of My Traits
In this biology activity, students identify and describe a number of easily observable genetic traits and compare the traits they have with other students. Then they identify and describe that some traits are common while others are not...
Curated OER
Is the Hudson River Too Salty to Drink?
Students explore reasons for varied salinity in bodies of water. In this geographical inquiry lesson, students use a variety of visual and written information including maps, data tables, and graphs, to form a hypothesis as to why the...
Curated OER
The Bouncing Ball
Students use the scientific method to conduct an experiment to test how a ball bounces. In this inquiry-based physical science and scientific method lesson, students drop a ball from specified heights and record the rebound, then record...
Curated OER
The Frozen Desert: Graphing and Comparing Climates
Students explore the concept of climate. They use temperature and precipitation data from their area and other regions to construct climate graphs. These graphs are used to help identify factors that influence climate.
Curated OER
What's the Fizz Factor
Students as a class create a fountain using both coke soda, and mentos candy. In this science activity, students test which combination of coke and mentos products produce the tallest fountain. Students use the scientific method to track...
Curated OER
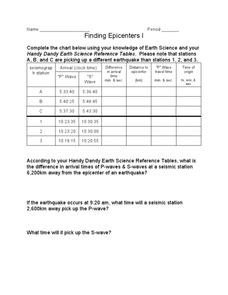
Finding Epicenters 1
In this finding epicenters worksheet, students complete a table given the "P" and "S" wave arrival times of 6 different earthquakes. Students calculate the difference in arrival time of the waves, the distance to the epicenter, the "P"...
Curated OER
Studying Fossils: Hominoid Skull Comparison
Students collect data on the differences in Hominid skulls using acrylic casts of fossil skulls. They measure a series of structures on skulls from six different species then use the data to determine evolutionary relationships between...
Curated OER
At the Edge of the Continent
Students study how to interpret a bathymetric map. They study the main features of the continental margin. They plot and graph bathymetric data. They think about and discuss the bathymetry of the edge of the cont
Curated OER
Making Connections-Review Experimental Design and Homeostasis
In this experimental design and homeostasis instructional activity, students complete 20 sentences with key terms about designing experiments, gathering data, graphing data and determining controls. They also complete sentences about...
Curated OER
Shoe Classification Lab
Students use shoes to make a classification flow chart. In this classification lesson plan, students all take one of their shoes off and put it on a table. In groups they create a classification system based on 3 characteristics of the...


