Curated OER
What's A Water Column Profile?
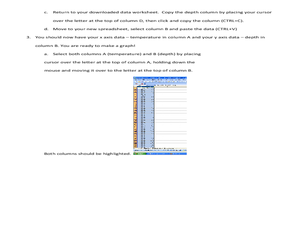
Learners investigate water column data. In this earth science and seawater instructional activity, students determine how temperature, salinity, and density have an impact on sea water by viewing and analyzing data obtained from a number...
Curated OER
DNA, RNA, Protein Synthesis, & Mutation
In this biology worksheet, students identify and label the diagram shown by stating what each part of the diagram represents on the line. Then they use the DNA strand as the original strand and complete the data table. Students also...
Curated OER
Cabbage Juice Lab
In this acid and base worksheet, students use cabbage juice as an indicator to test the pH of various solutions. Students complete a table with the solution name, the color red and blue litmus paper turns, the color the cabbage juice...
Curated OER
Determining the Enthalpy Change of a Reaction
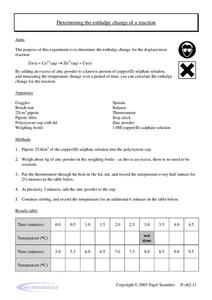
In this enthalpy of reactions worksheet, students use a known amount of copper (II) sulphate solution and an excess of zinc powder to calculate the enthalpy change of the reaction. Students measure the temperature change over the course...
Curated OER
Global Warming Statistics
Learners research and collect data regarding temperature changes for a specific location and find the mean, median, and mode for their data. In this climate change lesson plan, students choose a location to research and collect data...
Curated OER
Observing and Sketching the Lunar Surface
Students explore space science by conducting an illustration activity. For this lunar lesson, students discuss what the moon is and the role it plays for our environment on Earth. Students view images of the moon and utilize chalk to...
Curated OER
Inclined Plane and Pulley
Learners describe how inclined plane and pulleys make work easier. In this physics lesson, students calculate work done and mechanical advantage of both simple machines. They collect data from the experiment and construct graphs.
Curated OER
Banquet Menu Assessment: Exposure Investigation Exercise
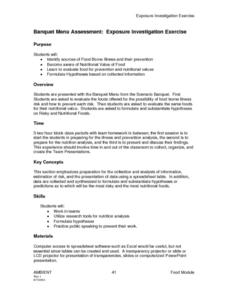
Students identify sources of Food Borne illness and their prevention. They formulate hypotheses based on collected information. Pupils become aware of Nutrintional value of food. Students collected data are synthesized to formulate...
Curated OER
Specific Heat of Air and Soil
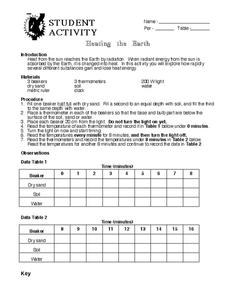
Students are introduced to the concept of specific heat. In groups, they are given a set of data showing the temperatures of air and soil samples in which they calculate the ranges of the data. They identify whether the air or soil...
Curated OER
Cities and Seasons
Students explore how satellite images show seasonal changes in seven cities in North and South America. Through a sequence of images, they study the green-up and brown-down of the seasons and how seasons change over time. Afterwards,...
Curated OER
Heating The Atmosphere
In this science worksheet, students look for the answers to finding the correct temperatures that match the location in the atmosphere.
Curated OER
Creating an Enzyme-Substrate Model
Students explore the reaction rates of an enzyme-mediated reaction through experimentation. In small groups, they use everyday objects to demonstrate the effects of environmental variables on enzyme function.
Students graph and...
Curated OER
The Reaction Between Magnesium and Hydrochloric Acid
In this rate of chemical reactions worksheet, students experiment with different concentrations and volumes of hydrochloric acid mixed with magnesium. They measure the rates of the reactions and analyze their results from a graph they...
Curated OER
How Do We Solve the Problem of Wildlife on Our Roads?
Students analyze data on elk ecology and movements across the highway. In this ecology lesson, students research ways to save them from highway collisions. They write a report and present their findings in class.
Curated OER
Identifying My Spider
Third graders navigate the Internet and research spiders. In this spider instructional activity, 3rd graders view photos of spiders and use their characteristics to determine the variety of spider. Students complete a spider data sheet.
Curated OER
Hurricane Frequency: Identifying Regions with Similar Numbers of Hurricanes
In this earth science worksheet, students answer 6 questions about the hurricane map and data provided. They create a data table based on the information provided on the map.
Curated OER
Explore Your Natural Habitat
Students identify habitats and understand why they are important to our environment. In this environmental lesson students design their own habitat, observe and record data on the impact their habitat has on the environment.
Curated OER
Energy and Changes of State
Students complete a variety of labs to help them explain how energy affects the changes in states of matter. They also be required to collect and record data, graph data, and apply interpretations of that data.
Curated OER
It'll Go With the Flow...
Students construct a water table elevation contour map and consider the direction and rate of groundwater flow to predict the actual runoff pattern. They discuss their findings and evaluate a hypothetical landfill site based on data...
Curated OER
Genetic Drift
Students use a mathematical simulation of genetic drift to answer questions about the factors that influence this evolutionary process. They run a series of simulations varying allele frequency and population size and then analyze their...
Curated OER
History of Rock
Students study a specific type of rock then share that expertise with other students in small groups. They view a rock and write observations about the rock to form small groups. In addition, they present their rocks an obervations to...
Curated OER
The Big Bang-Hubble's Law
In this Hubble's law instructional activity, learners use data for galaxies which include their distance and speed. Students make a graph to show the distance to each galaxy and the speed of each galaxy. They use their graph to answer 4...
Curated OER
Air Pollution:What's the Solution?-Weather's Role
In this air pollution and weather worksheet, learners collect data using an online animation to determine the air quality at given times along with the wind speed and temperature in a particular city. Students make 3 bar graphs using the...
Curated OER
Boyle's Law
In this Boyle's Law worksheet, students investigate the relationship between the pressure and the volume of a gas at constant temperature. They use a syringe and a pressure gauge attached to a computer to collect their data. They create...


