Curated OER
Gone Fishin'
Students explore fishing and the food web. They simulate the role of fisherman using candy as fish and use provided materials to create a fishing device. Afterward, they complete data tables to organize the day's catch and report the...
Curated OER
Hurricane Frequency and Intensity
Students examine hurricanes. In this web-based meteorology lesson, students study the relationship between ocean temperature and hurricane intensity. They differentiate between intensity and frequency of hurricanes.
Curated OER
Rules of the Roll
Students roll a ball down a plank and measure the distance it travels. Students graph the distances the ball travels as they change the height of the incline (increase slope).
Curated OER
Beans and Birds: A Natural Selection Simulation
Young scholars solve the following problem concerning the evolution of seed color in pinto bean plants: "How does natural selection change the frequency of genes or traits over many generations?" They use the constructivist approach to...
Curated OER
Cyber Chow Combos
Students, after watching the CYBERCHASE episode, "A Day at the Spa,"represent and count combinations of choices using tree diagrams.
Curated OER
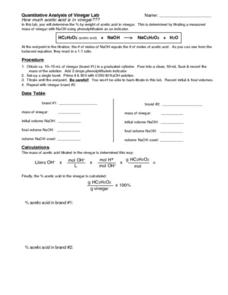
Quantitative Analysis of Vinegar Lab
In this quantitative analysis worksheet, students perform a lab to determine the amount of acetic acid in vinegar by doing a titration. They use an indicator phenolphthalein to determine the endpoint of the titration.
Curated OER
Show Me!
Young scholars analyze and interpret graphs. In this graphing activity, students view a video and construct their own graphs (line, circle, bar) from given sets of data.
Curated OER
Sediment Deposition Lab
Learners set up a stream table, observe erosion, and record data on where various sizes of sediments settle. They draw conclusions as to what kind of sedimentary rock form in what locations.
Curated OER
Keep It Cool
Students complete a science experiment to study insulation, heat transfer, and permafrost. In this permafrost study lesson, students design and test a soda insulator. Students graph their class data and discuss the results. Students...
Curated OER
Comparison of Snow Cover on Different Continents
Students use the Live Access Server (LAS) to form maps and a numerical text file of snow cover for each continent on a particular date. They analyze the data for each map and corresponding text file to determine an estimate of snow cover...
Curated OER
Probability: The Study of Chance
Students practice the basic principles of probability by conducting an experiment, determining if a game is fair, collecting data, interpreting data, displaying data, conducting analysis, and stating and applying the rule for probability.
Curated OER
Investigating the Shapes of Covalent Molecules and Measuring their Respective Bond Lengths and Bond Angles
High schoolers will draw Lewis structures of common covalent compounds using a Chem 3D computer program. They will predict the shapes of the molecules, complete a data table, and formulate rules for predicting shapes of molecules. In the...
Curated OER
Whose Brain is THAT?!
Learners explore various animal brains. In this animal anatomy lesson, students compare and contrast animal brains with the brain of a human. They record several characteristics in a data table for each brain they observe.
Curated OER
Finding the Basal Area of a Forest Plot to Determine Stocking Levels
Learners use graphs and plots to measure the basal area and stocking levels. In this graphing instructional activity students work in the field the use their data to help them complete a lab activity.
Curated OER
The Greenhouse Effect
Seventh graders investigate the temperature change in open and closed containers. In this earth science instructional activity, 7th graders relate this lab activity to greenhouse effect. They create a line graph from data collected in...
Curated OER
Observing Fall Migrants
Pupils observe the migration of monarch butterflies. They collect data regarding the number of monarchs they see, the location, the butterflies' behavior, the temperature and the date and time. Then they send their data to a university...
Curated OER
Acids and Bases
Students study acid and bases and how they fall on the pH scale. In this solutions lesson students complete a lob activity using litmus then fill out a data table.
Curated OER
Snow Cover By Latitude
Students examine computerized data maps in order to create graphs of the amount of snowfall found at certain latitudes by date. Then they compare the graphs and the data they represent. Students present an analysis of the graphs.
Curated OER
Plotting the Petroleum Plume
Eighth graders examine the difference between confining layers and aquifers in a basic water table aquifer scenario. They contour groundwater elevation and petroleum product thickness data.
Curated OER
Observing Fall Migrants
Students keep a detailed data collection log of the different types of monarch behavior. They track the weather conditions daily and link it to the migration of the monarchs. They summarize their data using either a graph or a computer...
Curated OER
Rates and Causes of Mortality in Classroom and Wild Monarch Larvae
Students collect larvae and observe them. The data tables are filled out and comparisons are made daily. The lesson plan progresses with more observations until larvae become adults.
Curated OER
Put It to the Test
Students identify different types of rock and sediments and how they react to acid through experimentation. Students use knowledge gained in thr experiment to identify types of rocks. Students create data tables for accuracy and clarity...
Curated OER
Mineral Matters
Students work in a team to use the ProScope Digital USB Microscope and a computer to collect microscopic images from a variety of mineral specimens. They compare specimens and determine how they are alike and different by comparing their...
Curated OER
What are Igneous Rocks and How are They Formed?
Crystals form before your very eyes! What sixth grader wouldn't enjoy this lesson plan on igneous rock formation? Using hot Salol, junior geologists observe the crystal formation process as the material cools. This comprehensive lesson...


