Curated OER
Multi-dimensional Modeling of Ore Bodies Making Sense of Empirical Data
Math scholars identify four different rock types in that strata and use this identification and data to construct a two dimensional geologic cross-section. They use data tables to construct a three-dimensional geologic cross-section.
Howard Hughes Medical Institute
Winogradsky Columns: Microbial Ecology in the Classroom
Winogradsky columns are ideal for observing the role of bacteria and other microorganisms in an ecosystem. This student activity guide is complete with data tables for observations and analysis questions for processing what was observed....
University of Southern California
Wave Erosion Lab
Using a stream table, erosion enthusiasts examine how the density of sediment and how the slope of land contribute to the amount moved by waves. You will not be able to use this entire resource as is; there are teachers' names and...
Curated OER
Science Survey
In this science survey worksheet, students think of a survey question to give to their classmates, create a data table to record responses, and then graph the results to their question. This worksheet has 4 fill in the blank questions...
McAuliffe-Shepard Discovery Center
Global Warming in a Jar
This well-organized lab activity introduces earth science pupils to the greenhouse effect. They will set up two experiments to monitor temperatures in an open jar, a closed jar, and a closed jar containing water. Ideally, you would have...
Science 4 Inquiry
Edible Plate Tectonics
Many people think they can't observe plate tectonics, but thanks to GPS, we know that Australia moves at a rate of 2.7 inches per year, North America at 1 inches per year, and the Pacific plate at more than 3 inches per year! Scholars...
Curated OER
Displacement Reactions of Metals
Chemistry stars experiment with metals to observe reactivity with salt solutions. They test magnesium, zinc, iron, and copper by immersing them into different solutions and observing for changes. A separate set of data tables is...
Serendip
Is Yeast Alive?
Through two investigations, life science learners determine whether or not yeast is alive. They perform tests for metabolism by providing sugar and observing if gas is produced as a byproduct. They incubate some of the sample for at...
Texas State Energy Conservation Office
Investigation: Blowing in the Wind
Using a simulated air sample, environmental or earth science pupils examine the components. You will need to prepare the faux air by using a hole punch and various colors of construction paper. Each color will represent a different...
Texas State Energy Conservation Office
Nuts! Calculating Thermal Efficiency
Oh nuts! Do macadamias or almonds produce more thermal energy? Energy enthusiasts find out with this experiment. The objective is to demonstrate to your class how the chemical energy contained in foods can be converted into useable...
Curated OER
Creating a Thematic Map
Students create and analyze a weather-related data table and a thematic map based upon information provided.
ARKive
Handling Data: African Animal Maths
Handling and processing data is a big part of what real scientists do. Provide a way for your learners to explore graphs and data related to the animals that live on the African savannah. They begin their analysis by discussing what they...
Noyce Foundation
Ducklings
The class gets their mean and median all in a row with an assessment task that uses a population of ducklings to work with data displays and measures of central tendency. Pupils create a frequency chart and calculate the mean and median....
Rice University
Introductory Statistics
Statistically speaking, the content covers several grades. Featuring all of the statistics typically covered in a college-level Statistics course, the expansive content spans from sixth grade on up to high school. Material comes from a...
Curated OER
Are You Full of Hot Air?
Explore the concept of measuring and recording circumference. In this physical science and measurement lesson, young learners blow up balloons, measure the circumference, and record the data on an interactive graphing website.
University of Georgia
Freezing and Melting of Water
Examine the behavior of energy as water freezes and melts. An engaging activity provides a hands-on experience to learners. Collaborative groups collect data and analyze the graphs of the temperature of water as it freezes and then...
College Board
2018 AP® Biology Free-Response Questions
The average AP Biology score dropped in 2018 with the addition of more data tables and graphs. Offer additional practice free-response questions by using the questions from the 2018 AP exam covering phylogenetic trees, cell structure and...
Curated OER
Plate Tectonics
Help young scientists piece together the theory of plate tectonics with this comprehensive collection of materials. Whether your are looking for worksheets, hands-on activities, or assessments, this resource has everything a science...
Physics Classroom
Electric Field Intensity
Learning about electrostatics can be pretty intense! Physics fanatics explore the factors that affect electric field intensity using an interactive from the Static Electricity series. Learners work to complete data tables that relate...
Institute of Electrical and Electronics Engineers
Playing with Parachutes
This lesson certainly will not be a drag! Little engineers design parachutes that make use of air resistance and, as a result, slow the descent of the payload as much as possible. It is an opportunity to teach about many motion concepts:...
Curated OER
The Periodic Table of Elements
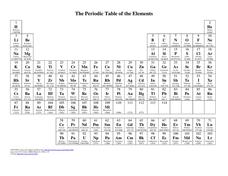
In this chemistry worksheet, students examine the periodic table of elements and use the data in other laboratory assignments.
Port Jefferson School District
Climate Patterns
Young climatologists explore the factors that contribute to a region's climate in this two-part earth science activity. To begin, learners are provided with a map of an imaginary planet and are asked to label global wind and ocean...
NASA
Exploration of a Problem: Making Sense of the Elements
When given too much data to simply memorize, it helps to sort it into manageable groups. The second lesson in the six-part series of Cosmic Chemistry challenges groups of pupils to take a large amount of data and figure out how to best...
Towson University
Looking Backwards, Looking Forward
How do scientists know what Earth's climate was like millions of years ago? Young environmental scholars discover how researchers used proxy data to determine the conditions present before written record. Grouped pupils gain experience...


