Curated OER
Here Today, Gone Tomorrow....?
Understanding the effects of an introduced species on the population of native species
Curated OER
Visual Models of Solutions and Concentrations
Students model solutions with beakers of colored glass or plastic spheres. In this solutions lesson, students use beakers of colored spheres to represent pure substances. They mix the spheres to demosntrate solutions. They discuss...
Curated OER
How Can They Tell?
Pupils compare the characteristics of arcade tokens to those of a circulating U.S. quarter to determine how a video game can tell the difference between the two. They examine coins and arcade tokens very closely to observe the differences.
Curated OER
Linear Functions
Students solve and graph linear equations. In this algebra instructional activity, students collect data and plot it to create a linear function. They identify the domain and range of each line.
Curated OER
Linking Algebra to Temperature
Students convert between two units as they calculate the temperature. In this algebra lesson, students collect data on seasonal climate and create a graph. They make conjectures based on their data collection.
Curated OER
The Cost of Smoking
Students explain the financial and life expectancy costs of smoking using a computer model to enter and adjust parameters to collect data in the form of a table. They analyze the data collected and determine the true cost of smoking.
Curated OER
Weather Report Chart
Young scholars complete a weather report chart after studying weather patterns for a period of time. In this weather report lesson plan, students measure temperature, precipitation, cloud cover, wind speed, and wind direction for a...
Curated OER
Lab Report Template
Students write a paragraph (complete sentences) which explains what they did in the lab.
Alabama Learning Exchange
The Very Hungry Class
Students listen to a read aloud of Eric Carle's, The Very Hungry Caterpillar, as an introduction to their study of the metamorphosis of a butterfly. They participate in a number of cross-curricular activities in this unit of lessons.
Curated OER
The Survey Says
Young scholars experience the development of statistical data. In groups, they construct a survey questionnaire for a target audience. Students produce the questionnaire, distribute it, collect it, and tabulate the data. Using EXCEL,...
Curated OER
Paper Parachutes
Students participate in a simulation of a parachute-jump competition by making paper parachutes and then dropping them towards a target on the floor. They measure the distance from the point where the paper parachute lands compared to...
Curated OER
Attributes of Accuracy
Young scholars explain necessity in using accurate instruments when measuring, and how measurements can be checked for accuracy. They make a six-inch ruler, design, test, and evaluate a system to measure work, and produce a table and...
Curated OER
Recognizing and Describing Chemical Changes
Seventh graders distinguish between physical and chemical changes in both natural and technological settings. They identify the reactants and products for a given chemical reaction. they then write simple chemical equations given the...
Curated OER
Hominoid Skull Comparison
Students are provided with evidence used to support evolutionary theory. They are introduced to classification by using primates as an example. Students read article related to Hominoid Skull Comparison and write a summary about the...
Curated OER
The Tongue...A Sense of Taste
Students explore the sense of taste. In this biology lesson plan, students consider 4 types of tastes, recognize the papillae or receptors on the tongue, and locate and label the different taste sense organs on the tongue.
Curated OER
Tune...Um!
Students collect real data on sound. For this algebra lesson, students use a CBL and graphing calculator to observe the graph created by sound waves. They draw conclusion about the frequency of sound from the graph.
Curated OER
What Can You Learn From A Mealworm?
Students collect data from mealworms. For this science and math lesson plan, students gain an understanding of collecting metric data using mealworms.
Curated OER
Technology Literacy Challenge Grant Learning Unit
First graders explore counting and classification. They sort leaves, create graphs, write sentences for the data in the graphs, develop graphs for shapes, favorite animals, birthdays, and participate in a die prediction game.
Curated OER
Finding a Line of Best Fit
Pupils engage in the practice of creating a scatter plot with the data obtained from measuring different resting heart rates. The data is used to create the table that is translated into a graph. The lesson gives instructions for the use...
Curated OER
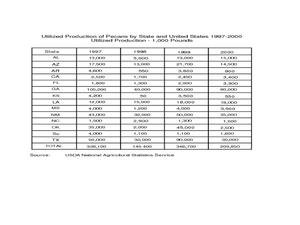
Pecan Power
Young scholars study the origins of pecans and complete a bar graph from the data they have discovered. In this pecan lesson plan, students draw pecans, discuss a pecan time line, and draw a bar graph comparing Arizona pecans to other...
Curated OER
Fingerprints
Students analyze their fingerprints. In this fingerprint lesson, students make prints and observe the patterns for arches, loops, and whorls. They write a brief autobiography about themselves titled "I'm Thumbody."
Curated OER
Ecosystem Interactions Web
Pupils pick an ecosystem (forest, desert, coral reef, open ocean, grassland, mountain, savanna, etc.) and design an interaction web for their chosen ecosystem. Each group shares their ecosystem's web of life with the class.
Curated OER
Shells and Subshells
Students explore how to show evidence of subshells and electron filling on the visual scale. They examine subshell filling and evaluate unknowns based on the atomic emission spectrum. Students design an experiment to identify colors of...
Curated OER
Animal Adaptations: Focus on Bird Beaks
Sixth graders explore bird beaks as animal adaptation. In this bird adaptation lesson, 6th graders conduct an experiment to determine the connection between the shape of a bird's beak and the food it eats.


