College Board
Using the Java Collections Hierarchy
Collect a set of collections. Professional development material provides teachers with information about collections that are in AP Computer Science. Materials include teaching strategies, sample labs, and worksheets. Educators use the...
Institute of Electrical and Electronics Engineers
Fun with Speedboats!
After reading about marine engineers and naval architects, it's all hands on deck to design and test a speed boat. This lesson is designed for the Next Generation Science Standards in engineering and can be a centerpiece for a STEM...
Howard Hughes Medical Institute
DNA Sequence Assembly
Oncologists use DNA sequence data to identify specific cancers and offer more targeted treatments. Grasp an understanding of the complexity involved by learning how the body sequences and assembles DNA. Eager scientists explore the...
Raytheon
Data Analysis and Interpretation
For this data analysis and interpretation worksheet, learners use charts, graphs, statistics to solve 42 pages of problems with answer key included.
Curated OER
Tables and Graphs Practice
For this table and graph worksheet, students are given three scenarios with data. They construct a table and a graph for each scenario.
Curated OER
Weather, Data, Graphs and Maps
Students collect data on the weather, graph and analyze it. In this algebra lesson, students interpret maps and are able to better plan their days based on the weather reading. They make predictions based on the type of clouds they see.
Curated OER
Constructing a Periodic Table of Elements
Students create a periodic table of elements. In this chemistry lesson, students work together to build all of the different elements into a complete mini periodic table. They identify similarity and difference of the elements.
Curated OER
What are the Trends in the Periodic Table?
In this periodic trends worksheet, students fill out a portion of a periodic table with the atomic number, the atomic radius, the number of shells and the number of outer shell electrons for each element shown. They answer six questions...
Curated OER
Interpreting Data and Building Hypothesis
Students define the term species, and graph species data together with previously collected data at the National Zoo. They interpret graphed data and recognize patterns in the streamside quadrant versus hillside quadrant. Students use...
NASA
Food For Thought
Science can be quite tasty. A delectable unit from NASA shows learners why it's important to consider food, nutrition, and health in space. Four lessons explore the idea in great depth, including testing cookie recipes. Along the way,...
South Penquite Farms
Measuring Soil Temperatures
Using an auger, start-up soil scientists bore a core of soil. They examine the sample and record the temperature at three depths in the borehole. This is an attractive activity sheet that succinctly guides your earth science class...
Curated OER
Exploring Wyoming Species Habitats
Students are introduced to the concept of species habitats and ranges. They introduced to ArcView GIS as a tool for mapping. Pupils use query data for species withina county, elevation, range, rivers and streams, land cover, and etc....
Curated OER
Aerosol Lesson: Science - Graphing SAGE II Data
Students examine and plot atmospheric data on bar graphs.
Curated OER
Experiment Report (Normal Form)
Here is a handy handout to give any science class as a guide to writing lab reports. It is a blank outline that you can have aspiring scientists fill out when they experiment, or imitate as they record their experiments in a lab journal....
Curated OER
5th Grade Science
In this science worksheet, 5th graders complete multiple choice questions about flight, astronomers, measurement, temperature, and more. Students complete 25 questions.
Curated OER
Science Review for Grade 3 (3.5)
In this science review for grade 3 (3.5) worksheet, 3rd graders answer 25 multiple choice questions in standardized test format about fossils, simple machines and heat transfer.
Curated OER
ACT Science Reasoning Test
The types of scientific information that need to be analyzed in the ACT test are presented here. Tips and techniques for completing the research, data, viewpoints, and multiple choice questions will help your class and their expectations.
Virginia Department of Education
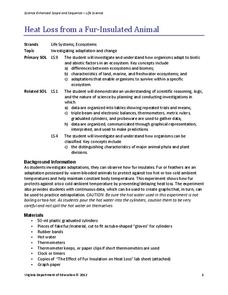
Heat Loss from a Fur-Insulated Animal
How do animals adapt to weather changes? Provide your class with the ability to understand adaptations and body temperature as they participate in this hands on experiment, using fake fur and hot water. Pupils collect data and analyze...
Space Awareness
The Climate in Numbers and Graphs
Weather versus climate: weather relates to short time periods while climate averages the weather of a period of many years. Scholars learn about average temperature and precipitation in various climate zones and then apply statistics...
Cornell University
Thin Films
Combine mathematics and science to calculate measurements of unmeasurable materials. Individuals use knowledge of density and volume to determine the thickness of the film used in production. They also apply stoichiometry to determine...
Curated OER
Impact Craters Activity
Lunar explorers perform an experiment to understand the size of the craters on the surface of the moon. They layer flour, laundry detergent, and cocoa powder in a pan to model the lunar surface. They drop marbles from different heights...
Curated OER
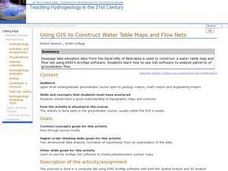
Using GIS to Construct Water Table Maps and Flow Nets
Students examine how to use GIS software to analyze patterns of groundwater flow. Seepage lake elevation data from the Sand Hills of Nebraska is used to construct a water table map and flow net using Esri's Arc Map software.
Curated OER
Interpreting Data from Birdfeeders
What kinds of birds live in your area? Read a book about birds to your learners and explore their feeding patterns. Charts and graphs are provided in this three page packet, but consider assigning the basic questions if using with young...
University of Georgia
Energy Content of Foods
Why do athletes load up on carbohydrates the evening before a competition? The lesson helps answer this question as it relates the type of food to the amount of energy it contains. After a discussion, scholars perform an experiment to...


