Curated OER
Cycles of Life in an Urban Habitat: Changes in Biodiversity
Second graders compare and contrast animate and inanimate objects. In this environmental science lesson, 2nd graders create simple food webs. They observe their environment and create a collage about it.
Curated OER
The Tilting Earth
Fourth graders use a styrofoam ball on a stick to represent earth and a light bulb in the center of the room to represent the sun. They walk around the light, holding their sticks at an angle to show the tilt of the earth's axis. They...
Curated OER
Understanding Seasons
Students complete activities to identify the different seasons. In this seasons lesson, students match seasons with pictures and complete a related worksheet.
Curated OER
Exploring Seasons
Learners study the four seasons. They determine changes that occur in our environment. They demonstrate an understanding of the basic features of Canada's landscape and climate and identify the basic weather and climate patterns of...
Curated OER
Classifying Plants and Insects
Art and science come together in a instructional activity based on Flower Still Life by Ambrosius Bosschaert the Elder. Learners classify plants and insects in the painting by color, leaf shape, size, reproduction, and season of bloom.
Curated OER
Seasons' Journey : Putting it All Together
Third graders complete a diagram of the revolution of the earth around the sun and write a one paragraph explanation of the factors that cause seasons.
National Wildlife Federation
I Speak for the Polar Bears!
Climate change and weather extremes impact every species, but this lesson focuses on how these changes effect polar bears. After learning about the animal, scholars create maps of snow-ice coverage and examine the yearly variability and...
National Wildlife Federation
I’ve Got the POWER! Solar Energy Potential at Your School
Should every school have solar panels? The 19th lesson in a series of 21 has scholars research the feasibility of using solar panels at their school. They begin by gathering data on the solar energy in the area before estimating the...
National Geographic
The Monsoon
Few things are as fascinating as the challenge of climbing Mount Everest. This lesson investigates how monsoon weather impacts climbers. To begin, you are instructed to show various video clips. The only one directly provided, however,...
Curated OER
Hurricane Season
For this science worksheet, students find the vocabulary terms related to the subject of hurricanes. The answers are found by clicking the button found at the bottom of the page.
Curated OER
The Reason for the Seasons; Science, Geography
Students think about what causes the seasons to change, reflect on what they know about seasons and how their lives affected by seasonal changes.
Curated OER
Earth and Seasons
Sixth graders comprehend that the path Earth takes as it revolves around the sun is called its orbit. They also comprehend that the axis is an imaginary line that passes through Earth's center and its North and South Poles. Students...
Curated OER
The Sun, Earth's Angles, and the Seasons
Students determine if the angle of light bombardment is a factor in heat absorption. They correlate these findings to the tilt of the Earth and the seasons. Students fold a pice of black construction paper in half, lengthwise. They tape...
Curated OER
The Earth
Third graders examine the relationship between the Earth and the Sun. They define key vocabulary terms, and in small groups conduct Internet research, exploring a variety of websites. Students answer comprehension questions, and...
Curated OER
What Causes the Seasons?
Students conduct experiment to examine how tilt of globe influences warming caused by lighted bulb. They monitor simulated warming of their city by sun in winter and in summer by using light bulb, interpret results, and submit lab report.
Vosonos
Interactive Minds: Solar System
Travel through space as you learn about the galaxy, solar system, planets, and much more. An extensive resource for studying astronomy in upper-elementary and middle school classrooms.
NOAA
Climate, Weather…What’s the Difference?: Make an Electronic Temperature Sensor
What's the best way to record temperature over a long period of time? Scholars learn about collection of weather and temperature data by building thermistors in the fourth installment of the 10-part Discover Your Changing World series....
NASA
Cloudy vs. Clear - Maps
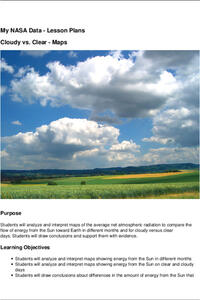
Find out the science of how clouds keep Earth cooler on hot days. Using guided discussions, investigators analyze and interpret maps of how much solar energy Earth receives at different times of the year. Participants draw conclusions...
Techbridge Curriculum
Calculating Rainwater Runoff
Thirsty plants soak up every bit of a rainfall, but what happens to the rain that hits the roof? Calculate the amount of rainwater from your school's roof with an Earth science activity, which brings measurement skills, observation...
National Wildlife Federation
Why All the Wiggling on the Way Up? CO2 in the Atmosphere
The climate change debate, in the political arena, is currently a hot topic! Learners explore carbon dioxide levels in our atmosphere and what this means for the future in the 11th installment of 12. Through an analysis of carbon dioxide...
Curated OER
A Comparison of Land and Water Temperature
Young scholars examine NASA satellite observations of surface temperature and investigate the seasonal changes of land and water temperature.
Curated OER
Weather and Water in Ghana
Students research the rainy and dry season to investigate Africa's weather. In this African weather lesson, students use the given websites to research the rainy and dry seasons of Ghana in Africa. Students then read stories about life...
Curated OER
A Map as a Tool
Students study the concept of using a map as a tool with the usage of a balloon designed to mimic the features of the Earth with the major features marked and shown on the balloon.
Curated OER
Cloudy vs. Clear
Students analyze line plots. In this weather lesson using real NASA data, students discuss how weather affects the way the Earth is heated by comparing different line plots.


