Curated OER
Lesson 3: Understanding Population Growth
Students explain population growth in Maryland and its relationship with age structure, household growth and consumption of land.
Curated OER
Antibiotic Resistance in E. coli
Pupils discuss the antibiotic resistance of bacteria. They design an experiment to test the resistance of different strands of E. coli. They answer discussion questions to end the lesson.
Curated OER
Snow Cover By Latitude
Students examine computerized data maps in order to create graphs of the amount of snowfall found at certain latitudes by date. Then they compare the graphs and the data they represent. Students present an analysis of the graphs.
Curated OER
Lab Experiments in Nutrition
Looking for authentic hands-on nutritional experiments? High schoolers will perform experiments to test for the presence of vitamin C in several solutions as well as the effect of caffeine on Daphnia. They will also consider the...
Curated OER
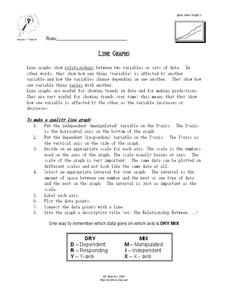
Line Graphs
In this algebra worksheet, students describe the relationship between a line graph and its data. They define the reasons line graphs are used and discuss increasing and decreasing lines. There is one involved questions, requiring several...
Curated OER
Scatter Plots
In this Algebra I/Geometry/Algebra II worksheet, learners create a scatter plot and analyze the data to determine if the data show any type of correlation. The four page worksheet provides extensive explanation of topic, step-by-step...
Shodor Education Foundation
Multiple Linear Regression
You'll have no regrets when you use the perfect lesson to teach regression! An interactive resource has individuals manipulate the slope and y-intercept of a line to match a set of data. Learners practice data sets with both positive and...
Curated OER
Interpreting Data from Birdfeeders
What kinds of birds live in your area? Read a book about birds to your learners and explore their feeding patterns. Charts and graphs are provided in this three page packet, but consider assigning the basic questions if using with young...
Curated OER
How Alike Are We?
Fourth graders find the range, mode, median, and mean for each of the data sets (height and shoe size). They discuss which measure of central tendency for each data set best represents the class and why. Students graph the shoe size and...
Curated OER
Data Analysis
In this data analysis worksheet, pupils solve and complete 4 different types of problems. First, they reduce the data provided to find the means, and graph the means in a line graph. Then, students graph the data from each mixture shown...
National Park Service
Same Colors, Different Flavors
Who says getting to know your neighbors has to be difficult? The first resource in a three-part series creates an engaging project that teaches your scholars about Canadian culture. A question-and-answer format takes place via e-mail and...
Curated OER
From Playing with Electronics to Data Analysis
Students collect and Analyze data. In this statistics lesson, students identify the line of best fit of the graph. They classify lines as having positive, negative and no correlation.
Curated OER
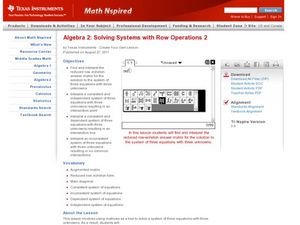
Solving Systems with Row Operations 2
Have your class solve equations using matrices by teaching them how to factor systems of equation to identify the point of intersection. They create their matrices on the Ti and perform row operations to simplify.
Curated OER
Triangle Midsegment
Learn how to calculate the length and midsegments of triangles. Students differentiate between similar and congruent triangles. They create a spreadsheet with their findings.
Curated OER
Graphing Inertia: An Oxymoron?
Eighth graders investigate Newton's Law of Inertia in order to create a context for the review of the use of different types of graphs. They practice gathering the data from an experiment and put it into the correct corresponding graph.
Curated OER
Creating a Bar Graph with a Graphing Program
Students use the S'COOL data base to create a bar graph.
PBS
Pbs: Cooking With Bill Nye: Dependent and Independent Variables
Making dinner become a math challenge and science experiment with Bill Nye. This interactive exercise focuses on using what you know about dependent and independent variables to make a prediction about whether boiling water with the lid...
Science Buddies
Science Buddies: Scientific Method Variables/hypothesis
Find out what variables are in a scientific investigation and what the difference is between an independent, dependent, and controlled variable. Look at samples of different types of variables and find out what makes a good variable.
CK-12 Foundation
Ck 12: Biology: Science Experiments
[Free Registration/Login may be required to access all resource tools.] Covers the scientific experimental design.
CK-12 Foundation
Ck 12: Scientific Method
[Free Registration/Login may be required to access all resource tools.] Describe how the Renaissance period in history changed the approach to science. Identify the steps of the scientific method. Differentiate between the independent...
CK-12 Foundation
Ck 12: Biology: Science Experiments
[Free Registration/Login may be required to access all resource tools.] Introduction to scientific experiments.
CK-12 Foundation
Ck 12: Earth Science: Observations and Experiments
[Free Registration/Login may be required to access all resource tools.] Using observations and scientific experiments to test hypotheses.
CK-12 Foundation
Ck 12: Earth Science: Observations and Experiments
[Free Registration/Login may be required to access all resource tools.] Using observations and scientific experiments to test hypotheses.
ClassFlow
Class Flow: Science Investigation Sheet
[Free Registration/Login Required] This flipchart gives a guideline for planning and conducting science experiments. It gives an organized approach to planning, obtaining evidence, presenting and evaluating the results.


