Shodor Education Foundation
Measures
Take a look at data from a statistical lens. An interactive allows pupils to enter data set, labeling the data including the units used. Manipulating the applet, learners select the statistics to calculate that include total, mean,...
Shodor Education Foundation
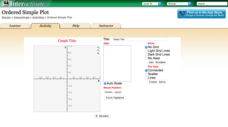
Ordered Simple Plot
Open your imagination to make algebra-inspired creations. An interactive lesson has scholars graph images from a set of parameters. Users can practice minimum values, maximum values, and scale as well as key features.
Achieve
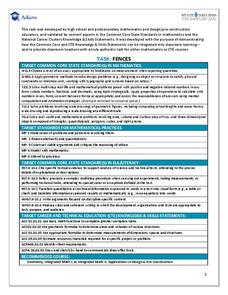
Fences
Pupils design a fence for a backyard pool. Scholars develop a fence design based on given constraints, determine the amount of material they need, and calculate the cost of the project.
Shodor Education Foundation
Algebra Quiz
Reviewing the process of solving equations is as easy as one click of a button. Scholars solve linear and quadratic equations by using a helpful interactive. The computer app automatically scores responses, providing immediate feedback...
Shodor Education Foundation
Equation Solver
Solve your equation and prove it, too. Young mathematicians solve linear equations using an interactive. They must input a property to justify each step of their solutions.
Shodor Education Foundation
Conic Flyer
Graphing conics made easy. Individuals use an interactive to graph conic sections. The app can handle circles, vertical and horizontal parabolas, ellipses, and vertical and horizontal hyperbolas.
Shodor Education Foundation
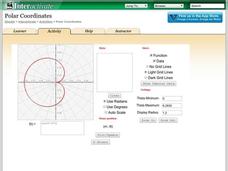
Polar Coordinates
Polar opposites might not work together—but polar coordinates do! The interactive provides learners the opportunity to graph trigonometric and algebraic functions using polar coordinates. The program takes either individual data points...
Shodor Education Foundation
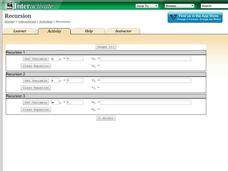
Recursion
Perform the operation ... and then do it again. Scholars investigate recursive formulas by creating and graphing them. Using the interactive, pupils set the variable, determine the initial value, and type in a recursive formula.The...
Shodor Education Foundation
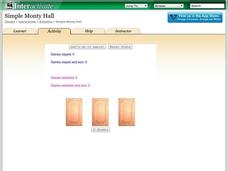
Simple Monty Hall
What's behind door number one? A fun resource lets learners simulate the classic Monty Hall probability problem. Pupils choose a door, and after they select a losing door, they decide whether to switch or stay. Using their decisions, the...
Shodor Education Foundation
Multi-Function Data Flyer
Explore different types of functions using an interactive lesson. Learners enter functions and view the accompanying graphs. They can choose to show key features or adjust the scale of the graph.
Curated OER
What's The Story?
Teams of learners integrate reading, writing, math, social studies, and science in this simple, yet effective lesson plan. They work in groups in order to solve a ten-step problem which requires internet research, the use of a...
Curated OER
It's a Penguin's Life!
Students will be studying the penguin community to observe the physical characteristics of the penguin and the relation it has to its community through a distance learning project with the Detroit Zoo.
Curated OER
Money in Action
Students become familiar with the various coins in our money system as well as amount of each coin. They help develop their ability to count change and find different ways to show equal amounts.
Curated OER
Kennedy Lesson Plan: Best Buddies
Students discuss disabilities. In this "Best Buddies" lesson, students take a look at programs that help people with disabilities and discover what role those people play in those programs. They work in pairs to explore the "Best...
Curated OER
Delayed Gratification
Word problems are great for engaging critical thinking skills, and word problems involving money increase a child's financial literacy. Boost your critical and financial thinkers with a multi-step word problem involving money and problem...
Curated OER
The Effects of the Calcium Ion on Cooked Dry Beans
Students investigate the effects of calcium ions on the quality characteristics of cooked dry beans. In this calcium ion and dry bean investigation lesson plan, students soak dry beans using 2 different soaking techniques and 2 different...
Curated OER
Elementary Concepts in Heat
Third graders read a thermometer with accuracy, record observations and data, and infer conceptual meaning. They integrate mathematical charting and graphing skills to organize their data. They explore what happens when they touch or use...
Curated OER
Range, Mean, Median, Mode
Students research the impact of craters. In this range, mean, median and mode lesson, students complete an experiment with a marble to simulate the effects of a crater. Students collect and analyze data finding the range, mean, median...
Curated OER
Meat Processing
In this meat processing worksheet, students learn how nitrates are used as curing agents for meat and how tenderizers work. Students compare meat treated with nitrates with meat that has not been treated. Students complete 8 short answer...
Baylor College
Fungus Among Us
In order to learn that mold spores can be found in the air, observers grow bread mold and make observations for a few days. Afterward, they participate in a class discussion to arrive at the knowledge that bread spores are present in the...
Cornell University
Scaling Down: Effects of Size on Behavior
Two activities explore the concept of size, especially small sizes down to the nano. Scholars practice determining volume, mass, and density and calculate exponential increases and decreases. They then predict and test the effect of size...
Mathematics Vision Project
Quadratic Functions
Inquiry-based learning and investigations form the basis of a deep understanding of quadratic functions in a very thorough unit plan. Learners develop recursive and closed methods for representing real-life situations, then apply these...
Pyro Innovations
Get into Shape
Shapes are so fun! Little ones explore, identify, and create shapes using tangrams or pattern blocks. The activity is intended to stimulate critical thinking while engaging learners through play and shape identification. Each child will...
Achieve
Ivy Smith Grows Up
Babies grow at an incredible rate! Demonstrate how to model growth using a linear function. Learners build the function from two data points, and then use the function to make predictions.


