Curated OER
Sun Spot Analysis
Students use Excel to graph monthly mean Greenwich sunspot numbers from 1749 to 2004. They perform a spectral analysis of the data using the free software program "Spectra". Short answer and thought questions related to the graphical...
Curated OER
Calculating & Graphing Using a Spreadsheet
Students use the lab apparatus to calculate the average velocity and average acceleration at several points and record the data. They use the spreadsheets to plot distance vs. time, velocity vs. time and acceleration vs. time graphs.
Curated OER
Science: Backyard Bugs Data Collection
Students practice data collection skills by observing common bugs found in their local environment. Once the data is collected they complete data sheets to compare, contrast, sort, and classify the insects. The lesson includes...
Curated OER
Weather Graphs
First graders use their knowledge of weather symbols to organize and construct a graph of the daily weather for one month. Each student have a chance to give the daily weather report using Sammy's Science House Computer Software.
Curated OER
Sampling Rocks
Learners examine how to take a sample by looking at rocks in the schoolyard. In this sampling lesson, students discuss ways to classify rocks by color, size, and weight. They think about how many rocks would make a good sample of...
Curated OER
Impact of Exotic Species on Lake Ecology
Students examine the effect of foreign species on various habitats. In groups, they identify the population dynamics of the zebra mussel. They calculate averages and graph data from Seneca Lake in New York. They develop hypothesis...
Curated OER
Interaction at a Distance
Students explore magnetism. In this magnetism lesson, students discover the purpose of different magnets. Students perform an experiment by testing the magnetism through different items. Students collect data on the experiment.
Curated OER
Weather, Sea Level Rise and Climate Change
Eighth graders compare and contrast weather and climate. In this earth science lesson, 8th graders research weather data site and analyze historical data. They present their findings in class and explain identifiable trends.
Alabama Learning Exchange
Who Sank the Boat?
Fifth graders experiment with student-made aluminum boats to test for buoyancy. They design a boat and determine how many marbles it takes to sink it while recording their data in a spreadsheet. They design a graph using the data and...
Curated OER
Simple Machines: The Wede & Lever
Students describe how wedge and lever makes work easier. In this physics lesson, students analyze experimental data by creating a graph to see the trends. They calculate the work done and mechanical advantage of these simple machines.
Curated OER
"Where is My Food?"
Students investigate the monarch's searching behavior and ability to find food. They determine whether or not a caterpillar can find food in a simple Y-shaped maze. They record and graph or chart the data from several attempts using...
National Wildlife Federation
Citizen Science to the Rescue!
You don't have to be a scientist or even out of high school to contribute to scientific research. In the 12th lesson in the series of 21, scholars use this opportunity to add to the growing body of scientific knowledge and consider the...
Curated OER
Solids, Liquids and Gases
Students explore solids, liquids, and gases. In this states of water lesson plan, students conduct a scientific investigation that requires them to observe and note the differences among solid, liquids, and gases.
Curated OER
Trundle Wheel
Sixth graders explore the uses of a trundle wheel. In this units of measurement lesson, 6th graders use trundle wheels to measure distances.
Curated OER
Drip, Drip, Drip
Students gather scientific data and be able to utilize the data to generalize results over a long period of time. They use the appropriate tools to measure quanities of liquids and analyze the data to determine the cost of a leaky faucet.
Curated OER
Delicious Graphing
Fourth graders sort trail mix by type and use that information to create different types of graphs for comparing.
University of Colorado
Happy Landings: A Splash or a Splat?
Huygens spacecraft landed on Saturn's moon Titan in 2005, making it the farthest landing from Earth ever made by a spacecraft. In this hands-on activity, the 12th installment of 22, groups explore how density affects speed. To do this,...
PHET
Soda Bottle Magnetometer
Introduce learners to set of complete instructions that describe how to build a magnetometer that works just like the ones professional photographers use to predict auroras. The diagrams are wonderfully descriptive, and the written...
Curated OER
Bodacious Buttons
First graders participate in games, graphing, and probability exercises to sort and graph buttons. They sort buttons with Venn diagrams and Bull's Eye graphs.
Curated OER
Teaching with Collections
Young scholars examine collections. In these real-world collections lessons, students examine and describe buttons and shells. Young scholars will then sort, classify, and graph items according to various indicated descriptors.
Curated OER
CSI Rhino
High schoolers study the rhinoceros and how the species has survived for so long. For this rhino lesson students create graphs and research what is being done to protect the rhino.
Curated OER
Can you Find the Expression
Students collect data from measurements and weights for this experiment. In this algebra lesson, students analyze graphs they create form their data to find the expression representing the data. They label which graph provided the best...
Curated OER
Balsa Wood Airplane Flight and Speed Correlation
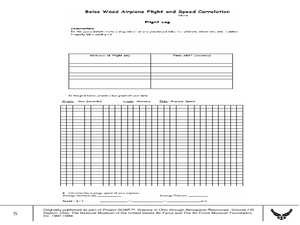
Ninth graders calculate the average speed of their balsa wood airplane. For this physics lesson, 9th graders build their own airplane and make necessary modifications to to make it fly straight. They interpret distance and time graph...
Curated OER
Great Flathead Lake Ecosystem Mystery
Pupils analyze data to solve the mystery of what contributed to an ecological disaster at Great Flathead Lake. They read and graph the available data, create a food web of the problem ecosystem, and construct a formal problem statement...


