Curated OER
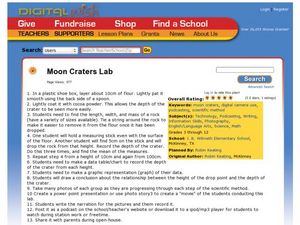
Moon Craters Lab
Students explore characteristics of mass. For this scientific inquiry about mass lesson, students drop rocks of different weights from various heights and record the depth of the "crater" created. Students record their findings on a...
Curated OER
Biospheres in Your Backyard
Students collect data from a local river biome. They use the information for metric conversion and graphing equations. They study the components of what makes up a biosphere and how math is used to analyze one.
Curated OER
Positive Future Fair Project
Ninth graders view the film "Pay It Forward" and discuss what kind of public campaign is needed to move people to positive action. They consider different ways of presenting information (graphs, visual displays, etc.) as tools for...
Curated OER
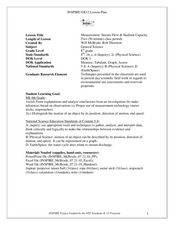
Measurement: Stream Flow & Stadium Capacity
Eighth graders study the scientific fields and how information can be monitored and recorded. For this scientific inquiry lesson students view a PowerPoint presentation and complete a hands on activity.
Curated OER
Scientific Investigation- Magnets
Students conduct a scientific investigation to determine if a magnet attracts paper clips through different materials. Students write out their procedures, collect data and present it in a table or chart, and analyze their results.
Curated OER
Hurricane Frequency and Intensity
Students examine hurricanes. In this web-based meteorology lesson, students study the relationship between ocean temperature and hurricane intensity. They differentiate between intensity and frequency of hurricanes.
Curated OER
Beans and Birds: A Natural Selection Simulation
Young scholars solve the following problem concerning the evolution of seed color in pinto bean plants: "How does natural selection change the frequency of genes or traits over many generations?" They use the constructivist approach to...
Curated OER
A Wet Welcome Home
Students investigate data collection and analysis. In this Algebra I lesson plan, students create a scatter plot and find the equation of best fit in a simulation of a leaking water pipe.
Curated OER
Review of the Scientific Method
Learners review the Scientific Method with a hands-on activity. Working with a partner, they hypothesize the number of water drops that fit on the heads side of a penny. They collect data and share their results with the remainder of...
Curated OER
Scientific Method
Students explore the scientific method. In this scientific method lesson, students use information gathered from a "Seed Dispersal" lab done previously to complete a worksheet listing the steps of the scientific method.
Curated OER
Charting and Graphing Sales
Students analyze and represent weekly sales figures using tables, bar graphs, and pie charts. They draw conclusions using bar graphs and pie charts. Students are told that each day at school they have the option of buying or bringing a...
Curated OER
Scientific Notation II: The Mantissa
Students after completing the Part II (of 2) scientific notation online lab exercises, manipulate and interpret large numbers expressed in the "mantissa and exponent" format of scientific notation.
Curated OER
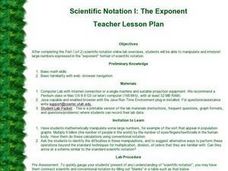
Scientific Notation I: The Exponent
Students manipulate and interpret large numbers expressed in the "exponent" format of scientific notation.
Curated OER
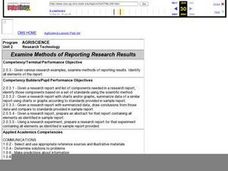
Examine Methods of Reporting Research Results
Students analyze a research report and the list of components needed in a research report and then identify those components based on a set of standards using the scientific method. They collect data which can be used for a graphical...
Curated OER
Introduction to Graphical Representation of Data Sets in Connection to Cellular Growth
Students practice graphing relationships between variables by studying topics such as exponential growth and decay. They conduct a series of numerical experiments using a computer model and a variety of physical experiments using mold,...
Curated OER
Interpreting Data-Working with Controls and Variables
Students review the meaning of control and variables, and state difference between dependent and independent variables. They complete a worksheet with the definitions and complete problems that show their understanding.
Curated OER
Waves
Light waves and sound waves are the focus of this science lesson designed for 5th graders. Besides discovering how these waves travel, learners also discover the basic properties of waves, and analyze data tables and graphs. The...
University of Colorado
The Moons of Jupiter
Can you name the three planets with rings in our solar system? Everyone knows Saturn, many know Uranus, but most people are surprised to learn that Jupiter also has a ring. The third in a series of six teaches pupils what is around...
Curated OER
Separate Vacations
Students plot the migration paths of birds using latitude and longitude data from a table.
University of Georgia
Heating and Cooling of Land Forms
Compare heating and cooling rates of different land forms. A lab activity has groups collect data on the rate of heating and cooling of soil, grass, saltwater, fresh water, and sand. An analysis of the rates shows how the different land...
Virginia Department of Education
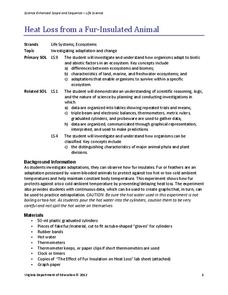
Heat Loss from a Fur-Insulated Animal
How do animals adapt to weather changes? Provide your class with the ability to understand adaptations and body temperature as they participate in this hands on experiment, using fake fur and hot water. Pupils collect data and analyze...
Curated OER
Changing Planet: Sea Levels Rising
Begin by showing a six-minute video, Changing Planet: Rising Sea Level as an anticipatory set. Pupils draw a topographic map of a potato continent. Finally, they will visit NOAA's sea levels online map and NASA's carbon dioxide...
NASA
Development of a Model: Analyzing Elemental Abundance
How do scientists identify which elements originate from meteorites? Scholars learn about a sample of material found in a remote location, analyzing the sample to determine if it might be from Earth or not. They study elements, isotopes,...
Curated OER
Mountain of Ice
Students graph and analyze chemical concentrations from ice core data. In small groups they prepare their graphs using colored pencils, and discuss the results.


