Curated OER
Sets: Always, Sometimes, or Never
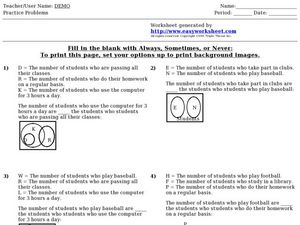
In this sets worksheet, students solve 4 fill in the blank problems. Kids determine if the given statement about a diagram is always, sometimes, or never true. Students use diagrams to determine which set of people overlap.
Mathematics Vision Project
Module 8: Probability
It's probably a good idea to use the unit. Young mathematicians learn about conditional probability using Venn diagrams, tree diagrams, and two-way tables. They also take into consideration independence and the addition rules.
Curated OER
Investigation: Sorting and Classifying
Fifth graders explore geometry by creating shapes with construction paper. In this shape characteristics lesson plan, 5th graders identify the different attributes that make up specific shapes and create them using construction paper,...
Math12
Basics of Probability
Give your students a fighting chance at understanding probability. Offering numerous examples that clearly demonstrate basic probability concepts, this resource helps young mathematicians learn how to visualize the different outcomes of...
Rice University
Introductory Statistics
Statistically speaking, the content covers several grades. Featuring all of the statistics typically covered in a college-level Statistics course, the expansive content spans from sixth grade on up to high school. Material comes from a...
National Security Agency
Are You Game? A Lesson Connecting Fractions and Probability
Exactly how fair are the board games children grow up playing? Young mathematicians investigate this questions as they work their way through this five-lesson series on basic probability.
Curated OER
Quarter Sorter
Graphing and sorting are such important skills for young learners to understand. Here, they will be given quarters to examine, they must come up with a sorting rule by which they will use to sort the quarters. They will sort their...
Curated OER
Sorting and Classifying
Fifth graders are engaged in sorting and classifying geometric shapes of various colors and sizes. They discuss the properties of these shapes and illustrate a range of classifications using Venn diagrams.
Curated OER
Thinking About Money
Students evaluate various approaches to spending money.For this spending money literacy lesson, students broaden their financial goals by reading "Alexander Who Used to Be Rich Last Sunday" and "A Chair for My Mother."Students use a Venn...
Hood River County School District
Text Structure: Features and Organization
Teach learners how to interact with both fiction and non-fiction text with a packet of activities and worksheets. After looking over text structure and the difference in text features between different types of writing, readers analyze...
Math Ocean
Fraction Word Problem Worksheets
There are actually several math topics covered by this set of problems. First is the addition of fractions and mixed numbers with both like and unlike denominators. Nine word problems are provided after some whole class practice.There...
Curated OER
Get Ready, Get Set, Hibernate
Students match each body part or idea from a work bank about methods of animal adaptations for winter survival. They observe as the first one, food is covered with the whole class before completing the rest of the diagram. They discuss...
Curated OER
Classifying Polygons
Seventh graders participate in a polygon hunt. In this polygon lesson, 7th graders examine how polygons are alike and different. Students create a Venn diagram and label the sorting circles. Students work in cooperative groups to sort...
Curated OER
Do You Have Number Sense?
Seventh graders are grouped according to their ability level with a captain who is elected by the students in that particular group. Students demonstrate their knowledge of rational and irrational numbers by defining them. Students use a...
Curated OER
Logic
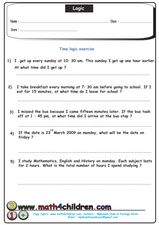
In this geometry activity, 10th graders investigate and solve various logic problems including the constructions and use of two way tables and Venn diagrams to assist in problem solving. The eleven page activity contains nine problems. ...
Pennsylvania Department of Education
Alike and Different
Students compare and contrast objects and are introduced to a Venn Diagram. In this alike and different lesson, students make observations regarding properties of objects. Students classify object and build ideas about variables....
Curated OER
Inequalities Compound Fram
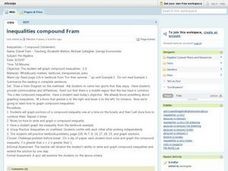
Students practice graphing compound inequalities. They draw a Venn Diagram on two different sports visualizing that their is a middle section on commonality among the two sports groups and then relate that concept to compound inequalities.
Curated OER
What is Soil?
Third graders examine what makes soil by creating a Venn Diagram. In this Earth environment lesson, 3rd graders identify the different components that soil is made from. Students bring soil from their homes to examine and create a Venn...
EngageNY
Probability Rules (part 2)
Ensure your pupils are rule followers! Learners add the addition rule to the set of probability rules examined in the previous lesson. Problems require both the multiplication and addition rule.
Curated OER
Worksheet - Chapter 1, 2 Combinations
For this combination worksheet, students draw Venn Diagrams, they determine the number of combinations of a particular event using tree diagrams or the fundamental counting principle. This one-page worksheet contains approximately eight...
Curated OER
George and Sam Save for a Present
Third graders develop their algebraic thinking by recognizing a variety of patterns using concrete objects, numbers, tables, and pictures. For this George and Sam Save for a present lesson, 3rd graders communicate their mathematical...
Curated OER
Frog and Toad
Second graders learn vocabulary and use of words, set, attribute Venn diagram. They learn to describe attributes.
University of Colorado
Are All Asteroids' Surfaces the Same Age?
Did you know scientists can tell the age of an asteroid by looking closely at its craters? This final lesson of a six-part series focuses on two asteroids, Gaspra and Ida, in order to demonstrate the concept of dating asteroids. Scholars...
National Security Agency
Line Graphs: Gone Graphing
Practice graphing and interpreting data on line graphs with 36 pages of math activities. With rationale, worksheets, and assessment suggestions, the resource is a great addition to any graphing unit.


