Curated OER
Rhombi and Squares Homework
In this geometry worksheet, students set up and solve formulas to find missing angles and segments. When solving for x, the equations are just linear. There are 15 questions with multiple parts.
Illustrative Mathematics
Sort and Count
Young mathematicians are on their feet and moving around in this primary grade sorting activity. After giving each child an object or picture card, they then sort themselves into groups, counting to see which has the most or least...
Curated OER
How Trees Contribute to the Water Cycle
In this water cycle instructional activity, 3rd graders conduct an experiment where they observe and calculate how water transpires in different types of trees. Students engage in a class discussion and use Venn Diagrams to compare...
Fluence Learning
Writing an Opinion: Buddies that Bark or Purr-fect Pets?
Which animal is best for you—a dog or cat? Why? Engage third graders in an opinion writing assessment that prompts them to read facts about both pets, and then write and decide which pet is best for them.
Virginia Department of Education
Inductive and Deductive Reasoning
Introduce pupils to the two types of reasoning, inductive and deductive. Classmates work in pairs or small groups to learn the difference between the two and apply these reasonings to develop valid conclusions.
Virginia Department of Education
Logic and Conditional Statements
If there is a conditional statement, then there is a hypothesis and conclusion. Pupils learn how to identify the parts of conditional statements. Class members continue to work with conditional statements and rewrite them in their many...
Growing Minds
Potato Exploration: Projects All About Potatoes!
How many potatoes tall are you? Unearth this rich resource! A reading of John Coy’s Two Old Potatoes begins a cross-curricular exploration of potatoes. Class members read, write, weigh, measure, and experiment with potatoes. Additional...
Curated OER
Model and Solve Algebraic Equations
Examine multiple ways to solve algebraic equations. Pupils will generate a problem solving strategy that addresses the prompt given by the teacher. They will then share their problem solving strategy with the class. Graphic organizers,...
Curated OER
Frog and Toad
Second graders learn vocabulary and use of words, set, attribute Venn diagram. They learn to describe attributes.
Curated OER
Mathematics Within: Bar And Pie Graphs
Students compare and contrast the use of bar and pie graphs with the same data. They create a data set by surveying all students in the class using sticky notes to make a table on the board. Then, each student creates a bar and pie graph...
Curated OER
Favorite Candy Bar Graph
Students decide on six different types of candy bars to include in a data collection activity. Working in small groups, they survey a target group in a set amount of time. They access a Internet based graphing tool to create a bar graph...
Curated OER
Tantalizing Tangrams
Students construct a set of tangrams. For this geometry lesson, students read the book, Grandfather Tang's Story and retell the story using tangrams. Students construct their own set of tangrams using the included worksheets.
Mathematics Assessment Project
Representing Probabilities: Medical Testing
Test probability concepts with an activity that asks pupils to first complete a task investigating false positive in medical testing and then to evaluate sample responses to the same task.
Institute of Electrical and Electronics Engineers
Coloring Discrete Structures
What's the least number of colors needed to color a U.S. map? The lesson begins by having pupils view a video clip on continuous and discrete phenomenon, then launches into an activity reminiscent of Zeno's paradox. A separate video and...
Curated OER
Math: Christmas Count Down
Students use various tools to calculate the number of days before Christmas. Among the tools are number lines, calendars, and the Internet. Each day, a student visits a Christmas Countdown Website to report the days left. At the end of...
Curated OER
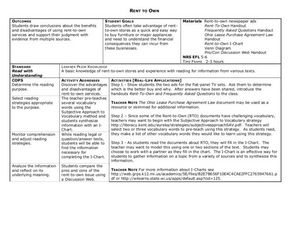
Rent To Own
Reading can be a good way to learn about many different things, like rent-to-own housing programs. Learners read informational resources about rent-to-own programs and how they work. They complete graphic organizers using the facts they...
Curated OER
Quilting Geometry
Study geometry through the concept of quilt design. High schoolers examine the geometric shapes in various quilts and then create their own quilts using geometric shapes that fit together. In the end, they write a paragraph to describe...
Curated OER
Children's Literature Across the Curriculum Ideas-Stone Fox
Students read and complete a variety of cross-curricular activities surrounding the novel, Stone Fox by John Reynolds Gardiner. Included are reading, math, science, writing, social studies, and library connections. A vocabulary/spelling...
Curated OER
PASS the Arts
Students explore math and art concepts, create digital art examples of the concepts, and incorporate these works into a PowerPoint portfolio with explanation and analysis.
Curated OER
Teaching in the Shared Way of Ghandi and Montessori
In this differentiated lesson plan, young scholars incorporate different subjects using the Ghandi and Montessori methods instead of the traditional method used in regular schools. In math they investigate shapes, colors and sizes. In...
Curated OER
Excel temperature Graphs
Students gather data about the weather in Nome, Alaska. In this Nome Temperature lesson, students create an excel graph to explore the weather trends in Nome. Students will find the average weather and add a trend line to their graph.
Curated OER
Probability
In this Algebra II instructional activity, 11th graders compare and contrast experimental probability and theoretical probability. The two page instructional activity contains explanation of topic, worked examples, and seven practice...
Curated OER
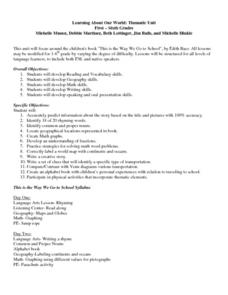
Learning About Our World
Learners explore their world using the book "This is the Way We Go to School." They predict information about the story based on the title and pictures. Students label a world map with the names of continents and oceans. They write a set...
Curated OER
What's Your Line?
Fifth graders collect temperature readings over a period of time, enter the information into a spreadsheet and choose the appropriate graph to display the results.


