Texas State Historical Association
Texas State Historical Association: Texas' Natural Environment
Presents information and data on all aspects of the geography, natural resources, and climate of Texas, including natural disasters and extreme weather events.
American Geosciences Institute
American Geosciences Institute: Earth Science Week: Dangerous Atmosphere
For this activity, students research what types of severe weather their county has had over the past 50-60 years. They will look at the severity of these events and the number of injuries and deaths they caused. They will then decide...
NOAA
Noaa: Operational Significant Event Imagery
This site contains satellite images from around the world organized by significant events such as dust storms, floods, severe weather, etc. Not very user friendly, but the images are there for those willing to search.
Center for Educational Technologies
Severe Weather: Hurricane Watch
Hurricanes are the most powerful of storms. Using satellite images, this site allows you to plot the path of a hurricane and predict when it will strike land.
Other
Weather Radar
These pages will provide you with information on severe weather and storm chasing. You can also find links to different radar images on the Internet so you can apply what is learned here. There are also many different topics like this...
TeachEngineering
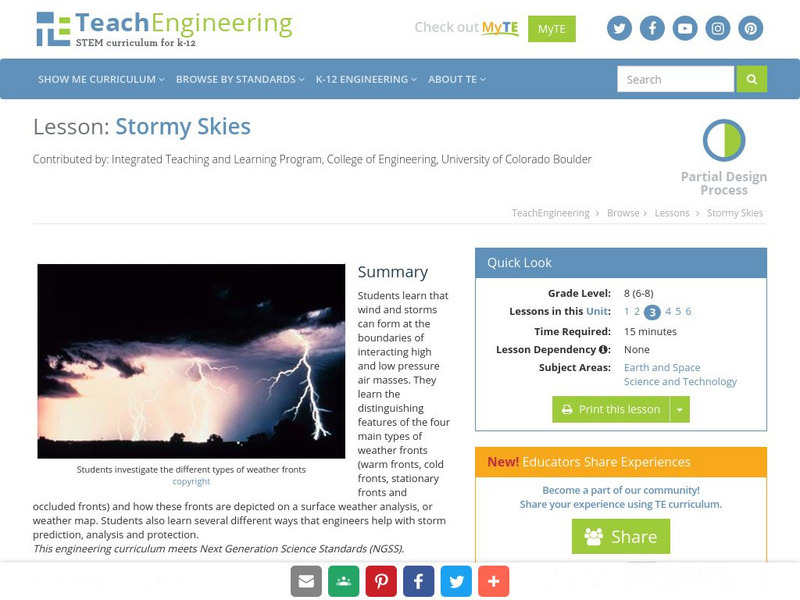
Teach Engineering: Stormy Skies
Students learn that wind and storms can form at the boundaries of interacting high and low pressure air masses. They learn the distinguishing features of the four main types of weather fronts (warm fronts, cold fronts, stationary fronts...
Better Lesson
Better Lesson: Design Solutions Engage, Explore
Third graders illustrate and write out notes for a plan (or several plans) to mitigate the effects of a local weather hazard.
Texas Instruments
Texas Instruments: Weather Study With Ti Interactive
Students will extract weather data from the web for several major cities. They will then display and discuss the data.
University Corporation for Atmospheric Research
Ucar: Differences Between Climate and Weather
For this activity, students collect weather data over several days or weeks, graph temperature data, and compare the temperature data collected with averaged climate data where they live.
Science Education Resource Center at Carleton College
Serc: Drought
Eight online learning labs which focus on the effects of drought, the quiet disaster. Each module takes students to external sites containing data, graphs, and articles. Several labs also require additional software programs: a...
CPALMS
Florida State University Cpalms: Florida Students: Natural Disasters
Enrich studying natural disasters like hurricanes and tornadoes. Know how to identify several types of natural disasters that occur in Florida, and describe how these disasters can affect people living there.
NOAA
Noaa: National Hurricane Center
Resource presents definitions of hurricanes, weather watches, warnings, and forecasts. View animations and learn about hurricane safety. Includes weather photos and further information.
TeachEngineering
Teach Engineering: Global Climate Change
Learners learn how the greenhouse effect is related to global warming and how global warming impacts our planet, including global climate change. Extreme weather events, rising sea levels, and how we react to these changes are the main...
NOAA
Noaa: Photo Library: Solar Powered Surface Automated Measurement (Sam) Site
The National Oceanic and Atmospheric Administration provides a photo library of severe weather formations and the instruments that measure them. Here you can find a photograph of a solar-powered Surface Automated Measurement (SAM) site....
University Corporation for Atmospheric Research
Ucar: Unidata: Conventional Weather Reports
This resource talks about how the stations report their information. Several examples of how different universities compile the information are provided.
Other
Kidstorm: Hurricanes
Get the facts on hurricanes with this detailed information page. This page includes photos, charts and satellite images.
Other popular searches
- Extreme Weather Lesson Plans
- Severe Weather Activities
- Severe Weather Phenomenon
- Severe Weather Safety
- Severe Weather Patterns
- Severe Weather Unit
- Effects of Severe Weather
- Severe Weather Lesson Plans
- Extreme Weather Project
- Extreme Weather Book Reports
- Living With Extreme Weather
- Causes of Severe Weather


