Teach Engineering
Global Climate Change
The greenhouse effect and its relationship to global warming is the focus of an activity that asks class member to consider the effects of climate change on weather. Pupils work with their families to determine their carbon footprints...
Curated OER
Weather, Data, Graphs and Maps
Students collect data on the weather, graph and analyze it. In this algebra lesson, students interpret maps and are able to better plan their days based on the weather reading. They make predictions based on the type of clouds they see.
Curated OER
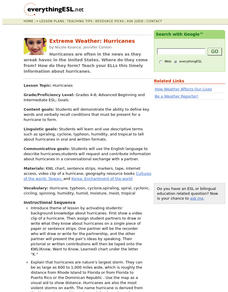
Extreme Weather: Hurricanes
Students demonstrate the ability to define key words and verbally recall conditions that must be present for a hurricane to form.
Curated OER
Reading A Weather Map
Ninth graders construct a weather map. In this meteorology lesson, 9th graders construct a weather map using contour lines and temperature.
KOG Ranger Program
Fire Behavior in Forests
Understanding the ways a fire will act is a key factor in fire safety and fire prevention. Young campers focus on how the weather and terrain can affect the behavior of a fire with topographic maps and different scenarios.
Wind Wise Education
What Causes Wind?
Through watching several classic air pressure demonstrations, middle schoolers determine that high pressure areas move toward lower pressure areas, heated air causes a drop in pressure, and forces exist when pressures are unequal. By...
Curated OER
Phenomenal Weather-Related Statistics
Eighth graders research, collect and interpret data about weather statistics. They record that data on spreadsheets. they create Powerpoint presentations on their individual or group research.
Curated OER
Twister Season Springs into Action
Students discover how weather conditions can give rise to severe storms and tornadoes. They study the different types of severe weather, how they can track conditions in their own neighborhood, and how to prepare for the worst.
Curated OER
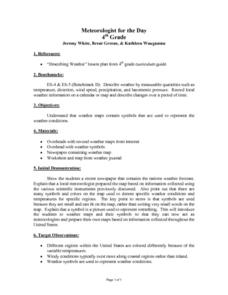
Meteorologist for the Day
Fourth graders examine the symbols used on weather maps. They analyze a newspaper weather forecast and identify and discuss the various symbols used on the map. Next, they prepare a weather map for their own city using the symbols...
Curated OER
American Focus on World Constitutions
Upper graders read several passages to gain an understanding of the nations that have adopted a constitution similar to the United States Constitution. This is a scripted lesson that is intended to build content-specific vocabulary and...
Curated OER
Thunderstorms and Lightning
Middle schoolers, in groups, investigate and demonstrate the science behind the development of lightning and thunderstorms.
MENSA Education & Research Foundation
Hurricanes
Learn the ins and outs of hurricanes through a series of lessons answering, "What is a hurricane? How does it travel? How is one formed, measured, and named?" Information is presented through informative text and images, while...
Curated OER
Linking Algebra to Temperature
Students convert between two units as they calculate the temperature. In this algebra lesson, students collect data on seasonal climate and create a graph. They make conjectures based on their data collection.
National Wildlife Federation
When It Rains It Pours More Drought and More Heavy Rainfall
Which is worse — drought or flooding? Neither is helpful to the environment, and both are increasing due to climate change. The 16th instructional activity in a series of 21 covers the average precipitation trends for two different...
Curated OER
Soil Investigations
Learners examine the basics about soil. In this soil lesson students describe the physical properties of soil and explain what soil profile is.
Curated OER
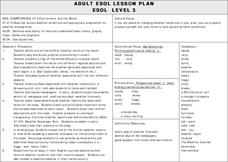
Weather Conditions
Students list and name various kinds of weather conditions occurring in their city. Using the newspaper as a resource, students answer questions relating to written weather reports. This lesson is intended for students acquiring English.
Curated OER
Myths and Legends on Natural Disasters: Making Sense of Our World
Young scholars explore different natural and manmade disasters through a webquest. In this earth science lesson, students explain their causes. They also discuss how disasters affect society.
Curated OER
Lesson Plans for Winter
Learners participate in several winter-themed lessons. In this seasonal instructional activity, students study penguins and polar bears by animal masks for dramatic play. Additionally, learners construct winter calendars and celebrate...
Curated OER
Shore is Windy!
Students consider what a hurricane is and how it impacts both land and people, explore the speculations surrounding Hurricane Isabel, research potential target sites and create maps illustrating how Isabel may affect them.
Curated OER
How's The Weather?
Students make a box and whiskers plot using the TI-73 graphing calculator. Each student would have their own calculator but they would work in small groups of two or three to help each other enter the data and make the plots.
Peace Corps
Weather and Water in Ghana
Young scholars investigate the climate of their region. Students research statistics and conduct interviews. Young scholars take a virtual tour of Ghana and discuss its climate. Students consider water conservation and the role it plays...
Curated OER
Making Waves: A Study of Earthquakes and Tsunami
Young scholars examine plate tectonics and the causative effect of earthquakes. In this tectonics lesson students differentiate between the types of energy waves that cause earthquakes and tsunamis and how waves travel at different...
Curated OER
Modeling Natural Disaster with Mathematical Functions
Ninth graders investigate the functional relationship of different environmental phenomena. In this math lesson, 9th graders create models of various natural disasters. They use logarithmic and exponential functions to interpret...
Curated OER
Picnic Possibilities
Fourth graders plan a picnic using weather data. Using accumulated weather data from various sources, they create a graph of the weather conditions in their region for a given period of time. Students interpret this data to predict the...


