Curated OER
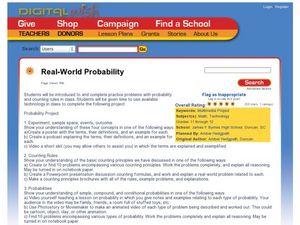
Real-World Probability
Students explore the concept of probability. In this probability lesson, students create a video, poster, or podcast explaining what experiments, sample space, events, and outcomes are in relation to probability. Students create a...
Curated OER
Ideas That Lead to Probability
Students explore and define the concept of probability. They utilize a random number generator to determine the fairness of a game. Internet and printable versions fo the activities are included.
Curated OER
Probability Popsicle Pop-ups
Fourth graders decorate and use popsicle sticks as manipulatives to assist with their learning of probability. They utilize a worksheet imbedded in this plan to organize the results of their experiment. They make a stem and leaf plot...
Alabama Learning Exchange
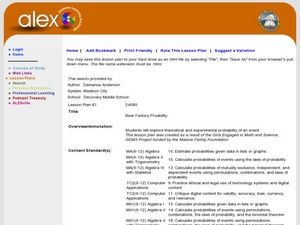
Bear Factory Probability
By examining a set of dice roll data, statisticians determine the probability of different sums occurring. They visit an interactive website and determine how many different vacation outfits Bobbie Bear will have based on the colored...
Los Angeles County Office of Education
Assessment for the California Mathematics Standards Grade 3
Assess scholars' knowledge with a 22-page assessment that covers place value, patterns, probability, estimation, measurement, geometric figures; and their ability to add, subtract, multiply and divide proficiently.
Curated OER
Probability and Sports
Middle schoolers research topics on the internet where probability is relevant. Students study statistics and probability concepts by looking at practical questions that arise in professional sports.
Curated OER
7-5 Practice Integration: Probability Compound Events
In this probability worksheet, students read story problems and draw tree diagrams to model the probability of compound events. After creating two tree diagrams, students compare them. They compute the probability of dependent events.
Curated OER
Theoretical and Empirical Probabilities
For this probability worksheet, students determine the theoretical probability of given events. Topics include choosing a card at random, number cubes, and fractions. This one-page worksheet contains ten problems.
Curated OER
Probability Game
Sixth and seventh graders complete and play a game that includes determining the probability of events. First, they list their names for each person playing. Then, everyone selects a number and roll the dice 100 times. They place a mark...
Curated OER
Chances Are......You're Right
Young mathematicians study probability. In this math lesson, learners calculate odds, and convert those into percentages of probability. Fractions are also used, making this lesson quite rich in some of the more difficult conversions...
EngageNY
Games of Chance and Expected Value 1
There's a strong chance that class members enjoy learning math through engaging games. Scholars analyze games of chance to determine long-term behavior. They learn to calculate expected value to help with this assessment.
EngageNY
Events and Venn Diagrams
Time for statistics and learning to overlap! Learners examine Venn Diagrams as a means to organize data. They then use the diagrams to calculate simple and compound probabilities.
Illustrative Mathematics
Sounds Really Good! (Sort Of...)
Winning a lottery game with 60% odds sounds like a no brainer. This is when the math kicks in to show players that in the long run, they lose money the more often they play. Here is one simple question that opens the doors to a nice...
Curated OER
Even/Odds Game
Using a game format, learners review what they know about theoretical probability. As they roll tetrahedron dice, they record their results as odd or even. Afterwards, they discuss their findings.
Curated OER
Mathematics Activities from Diverse Cultures
Connect probability and odds with different games from around the world. Pick from games like Dreidel, Mancala, and a Navajo stick game called Ashbil. All 12 games include probability questions to encourage a discussion before or after...
Curated OER
Rating Systems
Your favorite sports team is ranked #1. How do the powers that be determine this rating? Learn how ratings are mathematically computed using probability concepts, from the Elo Rating System for chess to the Rating Percentage Index for...
CK-12 Foundation
Venn Diagrams: T-Shirt Mystery
Sorting your t-shirts is easy with Venn diagrams. Individuals use a drag and drop interactive to classify shapes on t-shirts into Venn diagrams. A set of challenge questions tests whether the classification is correct.
Curated OER
Basic Probability
Students explore basic probability. In this Algebra II/Geometry lesson, students use modeling to solve basic probability problems involving real-life applications.
Mathed Up!
Two Way Tables
When presented with categorical data, a two-way frequency table is a great way to summarize the information. Pupils organize categorical data using a two-way table, then use the tables to determine missing data and to calculate simple...
Curated OER
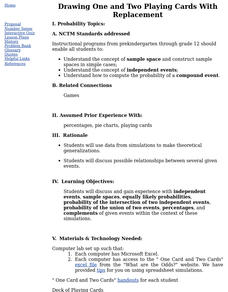
Drawing One and Two Playing Cards With Replacement
Math whizzes use data from simulations to make theoretical generalizations and discuss possible relationships between several given events. They use a simple card game to generate data to be analyzed.
Virginia Department of Education
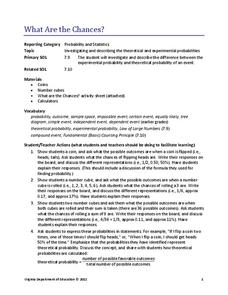
What Are the Chances?
Take a chance on an informative resource. Scholars conduct probability experiments involving coins and number cubes to generate data. Compiling class data helps connect experimental probability to theoretical probability.
Curated OER
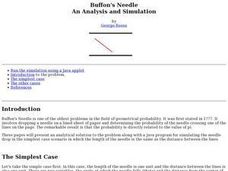
Buffon's Needle An Analysis and Simulation
If you dropped a needle on a lined sheet of paper what is the probability that the needle will cross one of the lines on the page? Surprise your class with how calculating this probability can approximate pi. This question is known as...
Curated OER
"Probably Pistachio" by Stuart J. Murphy
Students use manipulatives and examine situations where probability can be used.
Curated OER
Designing Samples/Simple Random Samples
Students consider the advantages and disadvantages of various sampling techniques. They define a simple random sample and identify possible sources of bias in other types of samples. Answer Key included.


