Curated OER
Theoretically Speaking
Students define probability. They determine outcome from a given situation based on simple probability. Students create experimental data using a coin and a number cube. They write how theoretical and experimental probability are different.
Curated OER
"A Closet Full of Shoes" and Picture Puzzle Piece" by Shel Silverstein
Students explain the concept of simple probability.
Curated OER
Analyze This
Sixth graders use a video and the internet to determine whether a game is fair or unfair. In this probabilities lesson plan, 6th graders determine the fairness of a game based on the probabilities of the outcomes.
Curated OER
EMS Lesson 2: Outrageous Offspring
Students investigate the principles of probability that can be used to predict hereditary traits.
Curated OER
Great Tasting Shapes
Fifth graders investigate the concept of median, mode, and range using a simple model for display purposes. They examine different shaped crackers out of a box and identify the ones that occur the most. Then the calculations for the...
Curated OER
Probability or Ability?
Students fill in a probability chart while attempting to catch candy with their non-dominant hands. They replicate the activity with a coin.
Curated OER
Money Vocabulary
Explore the monetary system by completing worksheets in class. Learners will identify the monetary units of England and collaborate in groups to solve money word problems. They also identify several money-related vocabulary terms before...
Curated OER
Creating a Bar Graph Using a Spreadsheet: Dice Rolling Probabilities
Tenth graders explore the concept of spreadsheets. They create a simple spreadsheet and chart from given data. Students perform basic formatting procedures on their chart. They use spreadsheet functions to perform calculations.
Curated OER
Penny's Pizza
Students develop a list of possible outcomes as a method of finding probability related to a pizza statistics problems. They read the problems together as a class, brainstorm ways to solve the problem, and in partners solve the pizza...
Curated OER
You Bet!
Students explore the mathematical probabilities involved in gambling and how these factors affect people's behavior. They work in pairs and conduct and experiment pertaining to blackjack. The class creates a graph showing the trends found.
Curated OER
Egg Fun
Students explore the physical properties of eggs. In this scientific observation instructional activity, students define characteristics of eggs, measure eggs vertically and horizontally, and use the scientific method to perform simple...
Curated OER
Designing Samples/Simple Random Samples
High schoolers explore the concept of sampling techniques. In this sampling techniques lesson, students identify possible sources of bias in situations such as phone polls, supermarket surveys, and drawing names from a phone book. High...
Curated OER
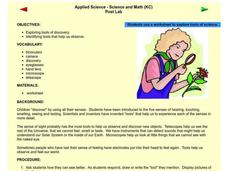
Applied Science - Science and Math Post-Lab
Students use scientific tools. In this Applied Science lesson, students investigate the use of scientific tools to enhance observation and discovery. Students indicate how each tool assists scientific work.
Curated OER
Data Analysis & Probability
Students make predictions based on survey results. They calcuate sample proportions. Students estimate the number of voters in their district preferring the democratic candidate using their sample results. They review sample proportions...
Curated OER
Matching Pairs
Students examine the probability of the various findings in a game and determine the odds of winning. They differentiate between the facts of odds versus probability. Students use higher order thinking skills to explain how a problem is...
Curated OER
Make the Highest Total
Sixth graders predict the outcome of a simple probability experiment, test it and explain the result by using problem solving strategies to explore situations mathematically. They then play a few games informally where students play in...
Curated OER
How Machines Help Us Stay Healthy
Students visit different departments at a local hospital to see how machines help peoples such as the CAT scan machine. They build a model of such a machine that shows how patients are moved in and out of the machine.
Curated OER
Data and Scientific Graphs
Learners conduct experiments and graph their data. In this statistics lesson, students collect data and graph it on a coordinate plane. They analyze the data looking for patterns and they discuss their findings with the class.
Alabama Learning Exchange
Meteor or Meteorite
Students differentiate between a meteor and meteorite. They participate in an experiment to discover how the size and weight of an object determines the size of the impact crater. They utilize their math skills by measuring with a ruler...
Alabama Learning Exchange
What's Your Favorite Chocolate Bar?
Young scholars complete a math survey. In this math graphs lesson, students complete a survey about their favorite candy bars. Young scholars create different kinds of graphs using Microsoft Excel to show their results.
Curated OER
You May Already Be a Winner!
Second graders flip coins and tally the outcomes. They play the You May Already Be a Winner! game with cards under their chairs. Some cards are winners, some might be and the others are not. They play to explain the probability concept.
Alabama Learning Exchange
Ice Cream Sundae Survey
Young scholars analyze data through graphs. They will complete a class survey on ice cream sundaes and tally and graph the responses. They then analyze the information from the class graph.
Curated OER
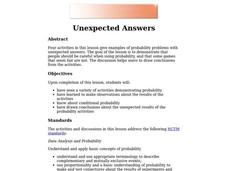
Unexpected Answers
Students explore and complete a variety of activities demonstration probability. They make observations about the results of the activities. Students complete and discuss conditional probability. Also, students draw conclusions about...
Curated OER
The Colored Cube Question
Fourth graders examine how to determine the probabilities or likelihood of outcomes. They complete trials to determine probability while using different manipulatives. They determine how games can be made fair or unfair in this unit of...


