Curated OER
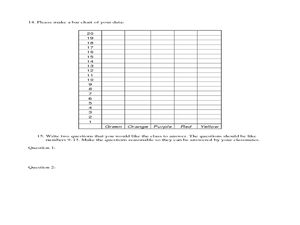
Skittle Math
In this skittle math worksheet, students sort skittles by color and create a bar graph for each color of skittle. Students also answer comparison, ratio, and relationship questions about the skittles.
Curated OER
Yummy Math
Young mathematicians use bags of Skittles to help them gain practice in graphing and organizing data. They work in pairs, and after they have counted and organized their Skittles, they access a computer program which allows them to print...
University of Arizona
Skittles & M&Ms Probability Experiment
Students are introduced to the scientific method by hypothesizing, counting, analyzing and concluding which company packs candy more reliably - Skittles or M&Ms.
Curated OER
Build A Skittles Graph
Young scholars explore graphing. In this graphing lesson, students sort Skittles candies and use the color groups to create a bar graph. Rubrics and extension activities are provided.
Curated OER
Skittles Galore!
Youngsters show understanding of accurate division of whole number, decimals, fractions, and percents using manipulatives (candies). They use white boards to demonstrate their understanding of representing numbers as defined in the...
Curated OER
Skittle it Up
Young scholars make a graph. In this graphing and Excel instructional activity, students work in groups and are given a bag of skittles. Young scholars count the number of each color skittle and create a table in Excel. Students learn...
Curated OER
Skittles, Taste the Rainbow
Fifth graders learn and then demonstrate their knowledge of a bar and a circle graph using the classroom data. Students are given a pack of skittles candy. Students create a bar and circle graph indicating the results of the contents of...
Curated OER
A Weigh we Go!
Here are some cross-curricular activities whil should help your kids understnad weight measurements and grammar. In this grammar and math lesson, students read the book Skittles Riddles and practice counting and balancing skittles. They...
Curated OER
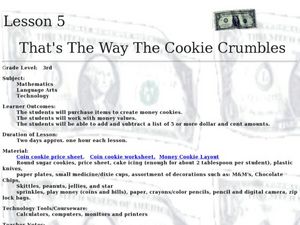
That's The Way the Cookie Crumbles
Third graders work with money values and making purchases. In this money lesson, 3rd graders listen to Donna Guthrie's book, Real World Math: Money and Other Numbers In Your Life. They make money cookies either with a recipe or with...
Curated OER
Junk Food Math
Students use Skittles candies as they explore estimation and percentages. In this math lesson plan, students sort, count, and chart Skittles candies to learn about estimation and study percentages.
Curated OER
Skittles Lab
Students use Skittles as manipulatives to practice computing decimals from fractions, computing decimals into percentages, and creating bar graphs from gathered data.
Curated OER
Math, Sweet Math
Third graders use candy to explore whole numbers one to hundred thousand. They place candy on a place value chart and explore how sweet math can be.
American Statistical Association
A Sweet Task
Candy is always an effective motivator! A fun math activity uses M&M's and Skittles to explore two-way frequency tables and conditional probability. The candy can serve a dual purpose as manipulatives and experimental data.
Curated OER
What's in a Graph?
How many yellow Skittles® come in a fun-size package? Use candy color data to construct a bar graph and a pie chart. Pupils analyze bar graphs of real-life data on the Texas and Massachusetts populations. As an assessment at the end...
Curated OER
Build a Skittles Graph
Students construct a bar graph with a given set of data. They calculate the ratio and percent of the data. Students discuss alternate ways of graphing the data as well as multiple strategies to approach the task.
Curated OER
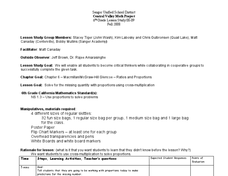
Using Proportions to Solve Problems
Skittles and math? Pupils will work as a class to determine how many orange Skittles are in a large bag by using proportions. They will problem solve, estimate, and share their thinking. Then, they will each receive a small bag of...
Curated OER
Statistics of Mars
Students explore the concept of central tendencies. In this central tendencies lesson, students sort M&M's or Skittles based on color. Students graph their results. Students find the mean, median, and mode of their data.
Curated OER
Is the Rainbow Fair?
Third graders perform statistical calculations. Given a bag of Skittles, 3rd graders sort and collect data regarding the colors included in their bag. Using spreadsheet software, students create a bar graph of the information collected....
Curated OER
Using Ratios to Taste the Rainbow
Students solve problems using ratios and proportion. In this algebra lesson, students analyze skittles and their different colors as they apply the properties of ratios and proportions to solve their problems.
Curated OER
Skittle Around with Fraction and Percentages
Fifth graders investigate the interchangeable relationship betweeen fractions and percents. They discuss the concepts using teacher provided questions. Then sutdents work in cooperative groups to maximize scaffolding.
Curated OER
Fractions, Decimals, Mixed Numbers, and Percents
Students convert fractions, decimals, mixed numbers and percents. In this fraction lesson, students use models to understand the conversion process. They then work in groups to find the fraction, percent, and decimal expressions for each...
Curated OER
Skittles® in the Middle
Fourth graders work in small groups, using bags of Skittles?? to determine the mean of one color of Skittles?? found in each bag, in each group, and in the entire class. This is a good lesson to help motivate students to explore mode,...
Curated OER
Skittle Graphing (Lesson Plan)
Learners discuss the uses of graphs. They use color candies to count and sort before designing graphs. They label the graph papers with appropriate titles and candy colors. They complete the graph bars, and discuss the results with a...
Curated OER
Skittles and Springs
Students experiment to discover the relationship between the stretch of a spring and the amount of weight attached to the spring using Skittles. They use a CBR and a graphing calculator to gather data.


