Curated OER
Mathematical Techniques - Basic Graphing
Students are introduced to significant figures and how to add, subtract, multiply and divide them. In a group, they practice plotting data points from a table to a graph and labeling all axes. They calculate the slope and y-intercept and...
University of North Texas
Math Exam 1 Review
Perfect as a review guide, this learning exercise provides a range of questions focusing on functions. Topics include composing functions, transformations, domains, and polynomials. Also included are corresponding worksheets focusing on...
Curated OER
Advanced Introduction to TI-8x Calculators: Programming in TI-Basic
Pupils program a TI-Basic calculator. In this calculator programming activity, students explore how to create and graph a linear equation. Pupils study how to input variables into the function and read the graph output.
Charleston School District
Solving Systems by Inspection
Can you solve a system by just looking at it? The previous lessons in the series taught three methods of solving systems of equations. Now learners discover they can determine the number of solutions of a system just by looking at it....
EngageNY
Equations for Lines Using Normal Segments
Describing a line using an algebraic equation is an essential skill in mathematics. The previous lesson in the series challenged learners to determine if segments are perpendicular with a formula. Now they use the formula to determine...
BW Walch
Solving Systems of Linear Equations
Solving systems of equations underpins much of advanced algebra, especially linear algebra. Developing an intuition for the kinds and descriptions of solutions is key for success in those later courses. This intuition is exactly what...
Virginia Department of Education
Linear Curve of Best Fit
Is foot length to forearm length a linear association? The class collects data of fellow scholars' foot length and the length of their forearms. They plot the data and find a line of best fit. Using that line, they make predictions of...
Curated OER
How Long Can You Go?
Eighth graders examine the usefulness of a line of best fit by collecting and graphing data, using a graphing calculator to determine the line of best fit, and making a variety of predictions. They watch a video, then design a...
EngageNY
Vectors and the Equation of a Line
Represent linear equations in both two and three dimensions using parametric equations. Learners write parametric equations for linear equations in both two and three variables. They graph and convert the parametric equations to...
Alaska Department of Education
Mathematics Reference Sheet
Triangles and prisms don't stand a chance when your learners use this handout full of the formulas they need to know about the different shapes. Area, volume, and surface formulas are all covered along with the standard measurement and...
Willow Tree
Approximating a Line of Best Fit
You may be able to see patterns visually, but mathematics quantifies them. Here learners find correlation in scatterplots and write equations to represent that relationship. They fit a line to the data, find two points on the line, and...
101 Questions
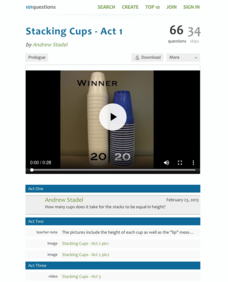
Stacking Cups
Facilitate an understanding of equality using a modeling task. After watching different-sized cups being stacked, learners use their math skills to determine when the height of each cup tower will be the same. Meant as an introduction to...
Charleston School District
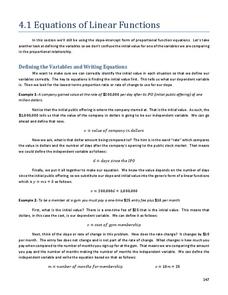
Equations of Linear Functions
Teaching linear function relationships using contextual information is beneficial to pupils' understanding. The lesson uses problem solving to build linear functions given different information for each problem. This is the second in a...
Curated OER
Do These Systems Meet Your Expectations
This lesson is all about systems of equations and their graphs. Algebra learners create and solve systems of equation using tables and graphing. They identify the point of intersection of a system of equation, and discover what the...
Curated OER
Graphing Inequalities in Two Variables
This study guide is a great resource to help you present the steps to graphing linear inequalities. Show your class two different ways to graph an inequality and work on a real-world example together. The document could also be easily...
Illustrative Mathematics
Chicken and Steak, Variation 2
Many organizations put on barbecues in order to make money. In a real-world math problem, the money allotted to purchase steak and chicken at this barbecue is only one hundred dollars. It is up to your potential chefs to figure out how...
West Contra Costa Unified School District
Shifting Linear Equations in Function Notation
Time for a shift in thinking! Learners examine translations of linear functions. They use function notation to describe the translation and make connections to the graph.
Curated OER
Graphing Systems of Inequalities
Solve equations and graph systems of inequalities. Designed as a lesson plan to reinforce these concepts, learners revisit shading and boundaries along with solving linear inequalities.
Virginia Department of Education
Exponential Modeling
Investigate exponential growth and decay. A set of six activities has pupils collecting and researching data in a variety of situations involving exponential relationships. They model these situations with exponential functions and solve...
Curated OER
Graphing Linear Equations on the TI-73
Eighth graders work in pairs with a TI-73 graphing calculator to complete a multiple-choice review using the Classroom Performance System. Each team uses a remote unit to "click in" the answers. When all teams have completed the review,...
West Contra Costa Unified School District
Introduction to Inverse Functions
Ready to share the beauty of the inverse function with your classes? This algebra II lesson guides the discovery of an inverse function through a numerical, graphical, and an algebraic approach. Connections are made between the three,...
Virginia Department of Education
Transformation Investigation
Graph it! Investigate transformations with a graphing calculator. Pupils graph sets of linear functions on the same set of axes. They determine how changes in the equation of a linear function result in changes in the graph.
Curated OER
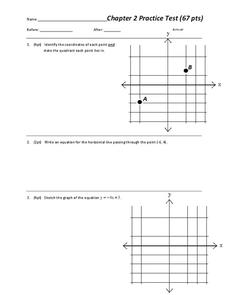
Chapter 2 Practice test
Overall, this worksheet contains a good selection of problems that reviews different aspects of linear equations. Learners examine and graph linear equations, absolute value equations, and inequalities in two variables. The three page...
Illustrative Mathematics
Two Lines
Here is a resource that helps your algebra learners understand the connection between the graph of two lines, the equations of lines, and the solutions and intersecting points of lines. It would make a great assessment question, but can...
Other popular searches
- Slope Intercept Form
- Slope Intercept Form
- Writing Slope Intercept Form
- Teaching Slope Intercept
- Algebra Slope Intercept Form
- Slope Intercept Graph
- X Y Slope Intercept
- Write Slope Intercept Form
- Algebra Slope Intercept
- Graph Line Slope Intercept
- Slope Intercept With Answers
- Slope Intercept Activity


