Curated OER
Multiplying Monomials
Students differentiate between linear and quadratic functions. In this algebra lesson, students write equations of graphs and graph a function from an equation. They also identify the slope and y-intercept.
Curated OER
Two Investigations of Cubic Functions
Through learning about cubic functions, students graph cubic functions on their calculator. Students determine the local maximum and minimum points and the tangent line from the x-intercept to a point on the cubic function. Students...
Shodor Education Foundation
Linear Function Machine
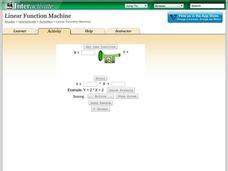
What goes in must come out! Learners play with a function machine to determine the correct function. They enter input values and watch as the machine produces the output.
Curated OER
Introduction to Linear Functions
Students are introduced to the basic ideas needed for understanding linear functions.
Curated OER
More Complicated Functions: Introduction to Linear Functions
Students explore the concept of linear functions. In this linear functions lesson, students translate linear functions from tables to graphs to equations. Students use an applet to write a function rule for a linear function in...
Curated OER
Graphing Linear Equations
In this calculator active graphing activity, students graph 12 equations via a calculator and transfer the graphs onto coordinate grids.
Curated OER
Graphing Linear Equations
Ninth graders develop an understanding of and the applications for linear equations and their graphical displays. They participate in a cooperative learning activity of matching a graphic display with an equation.
West Contra Costa Unified School District
Shifting Linear Equations in Function Notation
Time for a shift in thinking! Learners examine translations of linear functions. They use function notation to describe the translation and make connections to the graph.
Kenan Fellows
Let's Move
Find a statistical reason for a fresh start. Using a hypothetical scenario, individuals research statistical data of three different cities. Their goal? Find the best statistical reason for a business to move to a new location. Their...
Curated OER
Graphing and the Coordinate Plane
Students examine the four quadrants of Cartesian coordinate plane. They play maze games and coordinate games to discover how to read and plot points on the plane. Students plot points on the coordinate plane and examine the ratio of...
Curated OER
Be the Kiwi
Young scholars analyze linear equation. In this algebra lesson, students analyze and graph data. They solve problems involving linear equations and graph lines using the slope and y intercept.
Curated OER
Human Coordinate Plane
Eighth graders form a human coordinate grid to develop knowledge of the placement and meaning of coordinates on a grid. They experience the placements of the x and y coordinates in an ordered pair.
Virginia Department of Education
Factors, Zeros, and Solutions
Factors, zeros, and solutions, oh my! Don't let your classes become overwhelmed with the vocabulary. An engaging lesson plan helps learners make a connection between factors, zeros, and solutions. Pupils explore the relationship between...
Mathematics Vision Project
Module 8: Modeling Data
Statistics come front and center in this unit all about analyzing discrete data. Real-world situations yield data sets that the class then uses to tease out connections and conclusions. Beginning with the basic histogram and...
Mathematics Vision Project
Module 9: Modeling Data
How many different ways can you model data? Scholars learn several in the final module in a series of nine. Learners model data with dot plots, box plots, histograms, and scatter plots. They also analyze the data based on the data...
EngageNY
Comparing Linear and Exponential Models Again
Making connections between a function, table, graph, and context is an essential skill in mathematics. Focused on comparing linear and exponential relationships in all these aspects, this resource equips pupils to recognize and interpret...
EngageNY
Nonlinear Models in a Data Context
How well does your garden grow? Model the growth of dahlias with nonlinear functions. In the lesson, scholars build on their understanding of mathematical models with nonlinear models. They look at dahlias growing in compost and...
Curated OER
Writing Linear Equations
Students rewrite word problems using algebraic symbols. In this algebra lesson, students write linear equations using the slope and y intercept. They write equations given two points that are on the line.
Curated OER
Graphing Linear Equations
Students graph linear equations. In this algebra lesson, students perform transformation on linear equations. They identify the slope and y-intercept of each line.
Curated OER
Graphing and the Coordinate Plane
Students learn about the Cartesian coordinate plane, understand the four quadrants of the Cartesian coordinate plane, and plot points on the plane. Students read coordinates for a point from a graph and give the ratio of rise over run...
Alabama Learning Exchange
Graphing Stations
High schoolers explore the concept of graphing stations. In this graphing stations lesson, students head to various teacher set-up stations involving slope, point-slope, standard form, parallel lines, etc. High schoolers work problems...
Curated OER
Graphing Linear Equations with Calculator
Students graph lines using the calculator. In this algebra lesson, students graph lines of equations in the form y=mx+b. They input equations into the TI Calculator and graph using the slope and intercept. They analyze the graph for...
Curated OER
Products of Linear Functions
Students investigate the horizontal intercepts of functions. In this algebra lesson, students identify whether the factor of two functions results in a quadratic equation or not. They compare and contrast linear equations and higher...
Curated OER
Families of Functions
Students investigate families of functions. In this families of functions lesson, students discuss how changing a functions parameters affect its' graph. Students vary slope and y-intercepts of linear functions. Students stretch and...


