Curated OER
Linear Motion 6
In this linear motion worksheet, students answer 12 questions about acceleration, velocity and distance traveled. They interpret diagrams and indicate the location of an object if it has positive, negative or no acceleration. They...
Curated OER
Walking Home II
Students explore the relationship between distance and time. They analyze a situation involving distance traveled in a given period of time, represent the situation graphically and algebraically, and discuss the concept of slope as a...
Curated OER
Lines of Fit
Students analyze graphs. In this algebra lesson, students find the line of best fit, using scatter plots. They calculate the sale of popcorn as it relates to the price. They then analyze the graphs for positive, negative and no correlation.
Curated OER
Writing Equations from a Table
Students use coordinates in a table to write equations. In this algebra lesson, students discuss rate of change as it relates to slope and x and y values. They plot the points from a table to graph their lines and write an equation for...
Curated OER
How Many Solutions to the System?
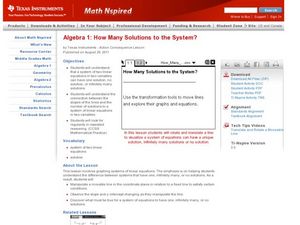
Solve systems of equation using graphing! In this algebra lesson, learners use the TI to graph two lines and identify the number of solutions. They perform interactive graphing on the navigator.
Curated OER
Be the Kiwi
Young scholars analyze linear equation. In this algebra lesson, students analyze and graph data. They solve problems involving linear equations and graph lines using the slope and y intercept.
Center of Excellence for Science and Mathematics Education
A Sick Astronaut
Aspiring astronauts graph, interpret, and analyze data. They investigate the relationship between two variables in a problem situation. Using both graphic and symbolic representations they will grasp the concept of line of best fit to...
Curated OER
Calculus Practice BC
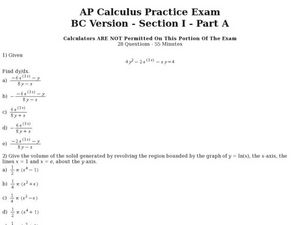
In this calculus worksheet, students solve functions using the derivatives. They calculate the volume where the graph is revolving around the x-axis, a line, the y-axis and where x=e. There are 28 questions.
Curated OER
Two Investigations of Cubic Functions
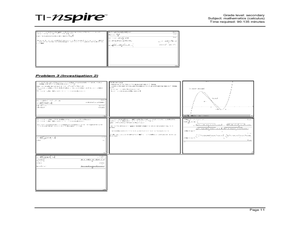
Through learning about cubic functions, students graph cubic functions on their calculator. Students determine the local maximum and minimum points and the tangent line from the x-intercept to a point on the cubic function. Students...
Curated OER
Systems of Equations
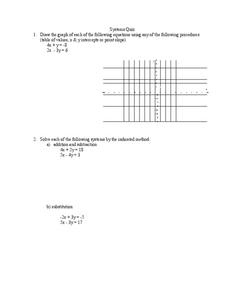
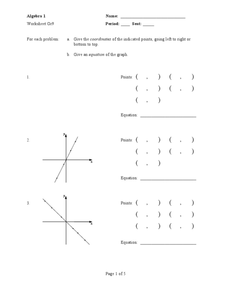
In this algebra worksheet, students solve systems of equation through graphing, linear combination and substitution. There are 3 questions.
Curated OER
Coordinates and Equations
In this algebra worksheet, students solve linear equations and plot their results on the coordinate plane. There are 20 problems using slopes and intercepts to help graph linear equations.
Curated OER
Advanced Introduction to TI-8x Calculators: Programming in TI-Basic
Pupils program a TI-Basic calculator. In this calculator programming activity, students explore how to create and graph a linear equation. Pupils study how to input variables into the function and read the graph output.
PBL Pathways
College Costs 2
What is the financial benefit for attending a community college for the first two years before transferring to a four-year college? The second part of the educational lesson asks young scholars to explore this question through data...
EngageNY
Nonlinear Models in a Data Context
How well does your garden grow? Model the growth of dahlias with nonlinear functions. In the lesson, scholars build on their understanding of mathematical models with nonlinear models. They look at dahlias growing in compost and...
Mathematics Vision Project
Module 9: Modeling Data
How many different ways can you model data? Scholars learn several in the final module in a series of nine. Learners model data with dot plots, box plots, histograms, and scatter plots. They also analyze the data based on the data...
Radford University
Calculating the Cost: Algebraic Planning for a First Car
Scholars decide which job to take based on the pay. They then research cars to potentially purchase and determine the total cost of the car. Finally, they calculate how long they would have to work to purchase the car along with how much...
Curated OER
Solving System of Linear Equations
Students solve systems of equations. In this algebra lesson, students identify the number of solutions to a system of equation. They solve using linear combination and graphing.
Curated OER
Linear Functions
Students solve, identify and define linear equations. In this algebra lesson, students calculate the slope and y-intercept of a line. They graph the line given two points and the slope.
Curated OER
Whose Line is it Anyway?
Students solve systems of equations. In this algebra lesson, students identify the domain and range of each function. They use the slope and y-intercept to graph each line.
Curated OER
Solving Systems of Linear Equations Graphically
Students solve systems of equations graphically. In this algebra lesson, students find the point of intersection of two lines if they are not parallel. They rewrite the equation in the y=mx + b form and graph using slope and intercept.
Curated OER
Relating Distance and Velocity Over Time
Students calculate the distance and velocity over time. In this algebra lesson, students graph a linear function to represent the distance vers time travel. They interpret their graphs and draw conclusion.
Curated OER
Real World Systems of Linear Equations
Students solve systems of equations with fluency. For this algebra lesson, students graph, use elimination and substitution to solve systems of equations. They identify the point of intersection using algebra.
Curated OER
Linear Functions-Learn Your Lines
Learners solve and graph linear equations. For this algebra lesson, students collect and plot data on a coordinate plane. They use the CBL and TI calculator to graph systems of equation.
Curated OER
High School Mathematics Problems from Alaska: Jesse Thomas Moose Hide Problem
Students solve problems about a student earning money for college by tanning moose hides.


