Curated OER
Slope Y-intercept Quiz
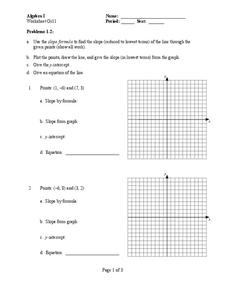
In this algebra learning exercise, students identify the slopes and y intercept of a line. They complete the quiz,by graphing and identify linear equations. There are 6 questions with an answer key.
Curated OER
Write the Equation of a Line Given the Slope and a Point
Students write the equation of a line given the slope and y-intercept. In this algebra lesson, students are given a point a the line and the slope of the line and are asked to write an equation of the line. They relate lines to real life...
Mt. San Antonio Collage
Test 1: Functions and Their Graphs
Save the time creating an assessment because these function problems should do the trick. With 10 multi-part questions, they each focus on a different topic including radical, polynomial, linear and piecewise functions. The majority of...
Curated OER
The Slope of a Curve
Students graph the slopes of a line using the intercepts. In this precalculus lesson, students identify the properties of a curve slope. They find the limit and use a graping calculator to graph their lines.
Curated OER
Graphing Applications
In this graphing applications worksheet, students derive equations for 4 word problems. Students then define variables, find intercepts, graph the equations, and interpret the slopes.
Curated OER
Gra[hing Linear Equations
In this Algebra I worksheet, 9th graders use the slope and y-intercept to graph a linear equation and fill in a table with the coordinates of the five points plotted. The seven page worksheet contains fourteen problems. Answers are not...
Curated OER
Integrals
In this integrals worksheet, learners solve and complete 22 different types of problems. First, they evaluate each of the listed integrals provided on the sheet. Then, students solve each of the differential equations. They also graph a...
Curated OER
Solving Systems of Equations by graphing for Algebra One
Students watch the teacher demonstrate on an overhead projector how to graph various equations before the students try them on their own. They start with pencil and paper; once they grasp the concept they move on to punching in the...
Inside Mathematics
Squares and Circles
It's all about lines when going around. Pupils graph the relationship between the length of a side of a square and its perimeter. Class members explain the origin in context of the side length and perimeter. They compare the graph to the...
CK-12 Foundation
Graphs in the Coordinate Plane: Functions on a Cartesian Plane
Connect the dots to graph a linear function. Young mathematicians use an interactive to first plot provided points on a coordinate plane. They connect these points with a line and then answer questions about the slope and y-intercept of...
CK-12 Foundation
Equations of Parallel Lines: Exploring Equations
Same slope, different point — what's the same and what's different about an equation? Young mathematicians use an interactive to position a line parallel to a given line and through a given point. They observe that the equation will have...
Curated OER
Am I Straight
Identify the slope of a linear equation in this algebra lesson. Middle schoolers graph linear equations using slopes and intercepts. They identify the slope as being positive, negative, no slope, or undefined.
Curated OER
Graphing Linear Equations and Inequalities
Pupils discuss methods to solve equations and inequalities with one variable. As a review, they write Addition and Subtraction properties of equality and Multiplication and Division properties of equality. Students graph points, write...
Curated OER
Slopey Math
Students identify the slope of a line and use it to solve real life problems. In this algebra activity, students write linear equations in slope intercept form and make a correlation to its relation to the real world. They use the slope...
Illustrative Mathematics
Distance across the channel
Here you will find a model of a linear relationship between two quantities, the water depth of a channel and the distance across the channel at water level. The cross section of the channel is the shape of an isosceles trapezoid. The...
Curated OER
Linear and Quadratic Model, Data Modeling
Learners model quadratic and linear equations. In this algebra lesson, students solve word problems using equations. They create scatter plots and make predictions using correlations.
Curated OER
US Airports, Assessment Variation
Determining relationships is all part of algebra and functions. Your mathematicians will decide the type of relationship between airports and population and translate what the slope and y-intercept represent. The problem is multiple...
Charleston School District
Graphs of Linear Functions
What does a slope of 2/3 mean? Develop an understanding of the key features of a linear function. Pupils graph the linear functions and explain the meaning of the slope and intercepts of the graphs.
CK-12 Foundation
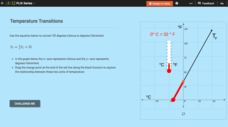
Linear Equations: Temperature Transitions
Explore linear conversions using an engaging interactive lesson. Learners drag a point on a graph to discover the equivalent degrees in Fahrenheit and Celsius. Embedded questions highlight key features such as slope and the y-intercept.
CK-12 Foundation
Input-Output Tables for Function Rules
Make the abstract a bit more concrete with an interactive that asks learners to slide an input value through a function to determine the output. Changing the slope and y-intercept allows them to see the how the output values change.
Mathematics Vision Project
Module 8: Modeling Data
Statistics come front and center in this unit all about analyzing discrete data. Real-world situations yield data sets that the class then uses to tease out connections and conclusions. Beginning with the basic histogram and...
Mathalicious
Domino Effect
Carryout the lesson to determine the cost of pizza toppings from a Domino's Pizza® website while creating a linear model. Learners look through real data—and even create their own pizza—to determine the cost of each topping. They explore...
Curated OER
Linear Equations
For this Algebra I worksheet, 8th graders write the equation of a line given two points and given a linear equation determine the slope, x-intercept, y-intercept, and graph the line. The five page worksheet contains ten problems. ...
Curated OER
Linear Equations
In this Algebra I worksheet, students determine the graph of the equation of a line. Students determine the x- and y-intercepts and graph. The three page worksheet contains six problems. Answers are not provided.


