Curated OER
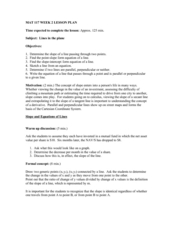
Lines in the Plane
Students differentiate between parallel and perpendicular lines. In this algebra lesson, students graph linear equations using the slope intercept form. They classify lines based on their slopes.
Curated OER
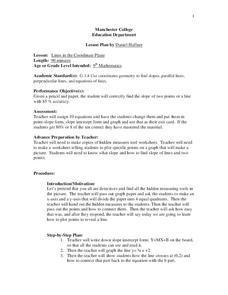
Lines in the Coordinate Plane
Students graph lines in a coordinate plane. In this geometry lesson, students graph lines on a coordinate plane, and identify the slope. They classify the lines as parallel or perpendicular and write an equation of a given line.
Curated OER
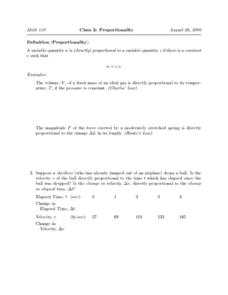
Class 2: Proportionality
In this proportionality worksheet, students are given 4 short-answer problems regarding change in velocity, time elapsed, point-slope form, and slope-intercept form.
Curated OER
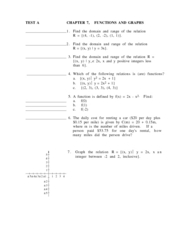
Chapter 7. Functions and Graphs
In this functions and graphs instructional activity, students determine the domain and range of a given relation. They graph functions on a coordinate plane and write equations in the slope-intercept form. This twelve page...
Curated OER
Solving Systems of Equations by graphing for Algebra One
Students watch the teacher demonstrate on an overhead projector how to graph various equations before the students try them on their own. They start with pencil and paper; once they grasp the concept they move on to punching in the...
Ohio Literacy Resource Center
Solving Systems of Linear Equations Graphing
Do you need to graph lines to see the point? A thorough lesson plan provides comprehensive instruction focused on solving systems of equations by graphing. Resources include guided practice worksheet, skill practice worksheet, and an...
Inside Mathematics
Graphs (2007)
Challenge the class to utilize their knowledge of linear and quadratic functions to determine the intersection of the parent quadratic graph and linear proportional graphs. Using the pattern for the solutions, individuals develop a...
Alabama Learning Exchange
Graphing Stations
High schoolers explore the concept of graphing stations. In this graphing stations lesson, students head to various teacher set-up stations involving slope, point-slope, standard form, parallel lines, etc. High schoolers work problems...
Curated OER
Linear Functions
In this linear functions learning exercise, students problem solve and calculate the answers to five linear equations associated with volume, point-slope forms, initial value forms and slope-intercept forms.
Curated OER
Rising Water
Eighth graders discuss a situation with quantities that relate in a linear fashion. They discuss ways to determine the relationship. Students represent this relationship with mathematic symbols. Students discuss the meaning of...
Curated OER
Perpendicular to an Equation through a Point
In this algebra instructional activity, students write a line perpendicular to given slope-intercept equation and a given point. There are 6 questions.
Virginia Department of Education
Linear Curve of Best Fit
Is foot length to forearm length a linear association? The class collects data of fellow scholars' foot length and the length of their forearms. They plot the data and find a line of best fit. Using that line, they make predictions of...
Curated OER
Applying Properties to Variables
Eighth graders combine like terms in this properties of variables lesson plan. Using named items (stars, moons and hearts), they combine like terms using variables. They use the distributive property to combine like terms. Finally, they...
West Contra Costa Unified School District
Standard Form of Conics
Looking for a complete go-to guide for the standard form of conics? This five-page packet does a nice job of connecting conics to prior knowledge of functions and transformations. Adapt the resource as Algebra II lesson plan notes, or...
Mathalicious
Pic Me!
Finally! Math and Instagram have come together to discuss the correlation between likes and followers. High schoolers can't help but want to discover what makes one account more popular than another by developing a line of best fit and...
Curated OER
Mystery Liquids: Linear Function
High schoolers determine the linear equations of the density of water and oil by collecting data on the mass of various volumes of each liquid. They construct scatter plots from the data and use these to write the linear equations for...
Virginia Department of Education
Factors, Zeros, and Solutions
Factors, zeros, and solutions, oh my! Don't let your classes become overwhelmed with the vocabulary. An engaging lesson plan helps learners make a connection between factors, zeros, and solutions. Pupils explore the relationship between...
University of Texas
A Library of Parent Functions
Don't think this lesson is for Mom and Dad; parent functions are all for your high schoolers. Flip through a presentation with a focus slide on each type of graph and its characteristics. Some examples are included but the focus is on...
West Contra Costa Unified School District
Graphing Systems
Get hands on with solving systems of equations graphically. A solid lesson plan uses guided practice to show how to solve systems of linear equations. It allows time for sharing ideas and provides a printable matching activity to promote...
BW Walch
Solving Systems of Linear Equations
Solving systems of equations underpins much of advanced algebra, especially linear algebra. Developing an intuition for the kinds and descriptions of solutions is key for success in those later courses. This intuition is exactly what...
Willow Tree
Approximating a Line of Best Fit
You may be able to see patterns visually, but mathematics quantifies them. Here learners find correlation in scatterplots and write equations to represent that relationship. They fit a line to the data, find two points on the line, and...
Curated OER
Systems of Equations: What Method Do You Prefer?
Learners explore the concept of solving systems of equations. In this solving systems of equations lesson plan, students watch YouTube videos about how to solve systems by graphing and by elimination. Learners use an interactive website...
Curated OER
How Long Can You Go?
Eighth graders examine the usefulness of a line of best fit by collecting and graphing data, using a graphing calculator to determine the line of best fit, and making a variety of predictions. They watch a video, then design a...
101 Questions
Stacking Cups
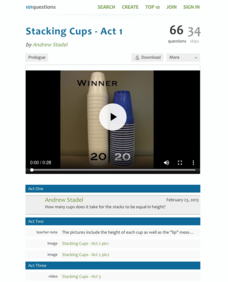
Facilitate an understanding of equality using a modeling task. After watching different-sized cups being stacked, learners use their math skills to determine when the height of each cup tower will be the same. Meant as an introduction to...
Other popular searches
- X Y Slope Intercept
- Y Intercept and Slope
- Slope Y Intercept Equation
- Slope Y Intercept Activities
- Slope Y Intercept Equation
- Graph Slope and Y Intercept
- Slope and Y Intercept Formula
- Slope Y Intercept Form
- Slope Y Intercept Graphing
- Slope Y Intercept Quiz
- Finding Slope and Y Intercept
- Slope, Y Intercept Quiz


