Curated OER
Writing Linear Equations
Students rewrite word problems using algebraic symbols. In this algebra lesson, students write linear equations using the slope and y intercept. They write equations given two points that are on the line.
US Department of Commerce
Educational Attainment and Marriage Age - Testing a Correlation Coefficient's Significance
Do women with college degrees get married later? Using a provided scatter plot of the percentage of women who earn bachelor's degrees and the median age at which women first get married over time, pupils conduct a linear regression...
Curated OER
Graphing Linear Equations with Calculator
Students graph lines using the calculator. In this algebra lesson, students graph lines of equations in the form y=mx+b. They input equations into the TI Calculator and graph using the slope and intercept. They analyze the graph for...
Curated OER
Families of Functions
Students investigate families of functions. In this families of functions lesson, students discuss how changing a functions parameters affect its' graph. Students vary slope and y-intercepts of linear functions. Students stretch and...
Curated OER
Linear and Nonlinear Functions
Pupils identify properties of a line. In this algebra lesson, students differentiate between functions and nonfunctions. They use the slope and y intercept to graph their lines.
Curated OER
Exploring Linear Equations
Eighth graders follow the teacher as they enter information into the graphing calculator. They investigate different graphs to explain the slope of a line, the y intercept, and parallel lines.
Curated OER
Graphing Linear Equations
In this calculator active graphing activity, students graph 12 equations via a calculator and transfer the graphs onto coordinate grids.
Curated OER
Solving Systems of Equations
Students identify the quadrants and axis of a coordinate plane. In this algebra lesson, students discover the ocrrect way to graph using the coordinate plane. They discuss the relationship between x and y values, domain and range and...
Virginia Department of Education
Factors, Zeros, and Solutions
Factors, zeros, and solutions, oh my! Don't let your classes become overwhelmed with the vocabulary. An engaging lesson helps learners make a connection between factors, zeros, and solutions. Pupils explore the relationship between the...
Curated OER
Solving Systems of Equations by graphing for Algebra One
Students watch the teacher demonstrate on an overhead projector how to graph various equations before the students try them on their own. They start with pencil and paper; once they grasp the concept they move on to punching in the...
West Contra Costa Unified School District
Shifting Linear Equations in Function Notation
Time for a shift in thinking! Learners examine translations of linear functions. They use function notation to describe the translation and make connections to the graph.
Alabama Learning Exchange
Graphing Stations
High schoolers explore the concept of graphing stations. In this graphing stations lesson, students head to various teacher set-up stations involving slope, point-slope, standard form, parallel lines, etc. High schoolers work problems...
Curated OER
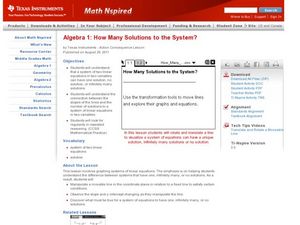
How Many Solutions to the System?
Solve systems of equation using graphing! In this algebra lesson, learners use the TI to graph two lines and identify the number of solutions. They perform interactive graphing on the navigator.
Curated OER
Mystery Liquids: Linear Function
High schoolers determine the linear equations of the density of water and oil by collecting data on the mass of various volumes of each liquid. They construct scatter plots from the data and use these to write the linear equations for...
Curated OER
Exploring Linear Equations
Third graders use graphing calculators to graph equations. They make visual models of algebraic expressions and they can readily see that an equation represents something.
5280 Math
More or Less the Same
Tell the story of the math. Given a graph of a linear system, learners write a story that models the graph before crafting the corresponding functions. Graphs intersect at an estimated point, allowing for different variations in the...
Curated OER
Kinetics of acetone iodination
In this chemistry worksheet, students examine the given concept in order to apply in the laboratory setting. The sheet includes in depth background information.
Rochester Institue of Technology
Meal Picking
Scholars explore systems design and its relation to meal picking by using computer simulations to test systems designs. They learn about the Pick-to-Light System and calculate average picking times.
Curated OER
Off to College
High schoolers investigate linear, quadratic and exponential equations using the TI calculator. They identify relation and functions using ordered pairs, graph the data, analyze the data, and relate it to real-world situations.
Virginia Department of Education
Transformation Investigation
Graph it! Investigate transformations with a graphing calculator. Pupils graph sets of linear functions on the same set of axes. They determine how changes in the equation of a linear function result in changes in the graph.
Curated OER
The Way to Better Grades!
Pupils collect and analyze data. In this statistics lesson, learners create a scatter plot from their collected data. They use, tables and graphs to analyze the data and mae decisions.
Curated OER
Proportionality in Tables, Graphs, and Equations
Students create different methods to analyze their data. In this algebra lesson plan, students differentiate between proportion and non-proportional graph. They use the TI-Navigator to create the graphs and move them around to make their...
Curated OER
Proportions in Stories
Students solve problems dealing with ratios and proportions. In this algebra lesson, students rewrite word problems using equations and symbols. They correctly convert between percents and decimals.
Curated OER
Linear Progression
Learners use graphing calculators to graph lines and create tables of values. They perform an experiment using M&M's and slinkys, then create their tables based on their results.


