Curated OER
Finding Equations From Graphs
In this equations from graphs worksheet, 9th graders solve and graph 10 different problems that include determining the actual equation for each. First, they determine the slope and y-intercept for each graph shown on the right. Then,...
Curated OER
Functions and Relations
In this functions and relations worksheet, 11th graders solve and complete 15 various types of problems. First, they find the slope and y-intercept for each function given. Then, students find the slope of the line passing through the...
Curated OER
Point-Slope Form of a Line
This activity helps young mathematicians connect the graph and the point-slope form of a line, by first solving a real-world problem and then using that example to motivate the understanding of the equation. By manipulating the gizmo,...
Curated OER
Introducing y = mx + b
Middle and high schoolers use the slope intercept form to graph a line. In this algebra lesson, pupils rewrite equations from standard form to y-intercept form. They use the slope and y-intercept to graph a line without making a table of...
Curated OER
Slope Intercept Form
In this slope intercept form instructional activity, students solve and graph 6 different problems that include identifying the slope and intercepts in each graph. First, they determine the line that has a given x-and y-intercept. Then,...
Curated OER
Writing and Graphing Linear Equations on a Flat Surface
In this linear equations worksheet, students write the equation of a line with given characteristics. They identify the slope of a line and the y-intercept. Explanations and examples are provided at the beginning of the worksheet. This...
Alabama Learning Exchange
We Love to Graph!
Young scholars experience graphing points. In this graphing points instructional activity, students play an on-line game where they must name 10 coordinate pairs correctly. Young scholars play a maze game where they maneuver a robot...
Curated OER
Graphing Solutions
In this graphing solutions worksheet, 9th graders solve 13 various types of problems. First, they find the solution of each systems by graphing on the coordinate plane provided. Then, students solve each systems of equations...
Curated OER
Graphs & Equations of Lines
In this graphs and equations of lines worksheet, 10th graders solve 12 different problems that include graphs and various equations of lines. First, they determine the slope of a line that passes through two sets of points. Then,...
Curated OER
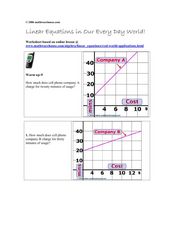
Linear Equations in Our Every Day World!
In this linear equations learning exercise, students read and interpret graphed linear equations. They read a story problem, write a linear equation, and plot the points on a coordinate plane. This five-page learning exercise cotnains...
Curated OER
Integrals
In this integrals worksheet, learners solve and complete 22 different types of problems. First, they evaluate each of the listed integrals provided on the sheet. Then, students solve each of the differential equations. They also graph a...
Curated OER
Flight of Angles of Inclination
Students measure the flight of a gilder. In this fight of angles lesson, students explore the flight of a glider and measure the distance flown. They collect statistical data of the flights and determine the slope of each flight. ...
Curated OER
Investigating Slope
In this investigating slope learning exercise, students use their graphing calculators to graph equations of a line with negative and positive slopes. They observe differences between the positive and negative slopes and write a rules...
Curated OER
Rocketsmania And Slope
Learners use a professional basketball team's data and graph it on a coordinate plane. They draw a line of regression and finding its equation. They access a website containing statistics for the Houston Rockets basketball team to solve...
Curated OER
Graphing Functions
In this graphing functions worksheet, 10th graders solve 10 different problems that illustrate various graphs of functions. They determine the type of function that each graph shows. Then, students write the equation for the line graphed...
Inside Mathematics
Graphs (2007)
Challenge the class to utilize their knowledge of linear and quadratic functions to determine the intersection of the parent quadratic graph and linear proportional graphs. Using the pattern for the solutions, individuals develop a...
Curated OER
The Slope of a Line
For this slope worksheet, students examine graph and determine the slope of a line. They determine coordinates of a point to make a true statement. Students identify the dependent variable and the independent variable. This three-page...
Curated OER
Getting Started with the TI-Navigator™ System: What's My Line?
Learners analyze linear functions in this algebra activity. They explore the meaning of slope and the slope-intercept form of a line as they investigate the effect changing parameters on the graph of a linear function.
Curated OER
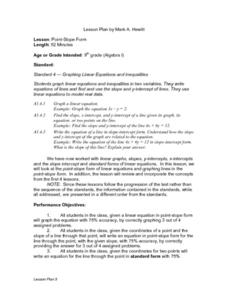
Point-Slope Form
Ninth graders explore the point-slope form of linear equations and graph lines in the point-slope form. After completing the point-slope equation, they identify the slope of a line through a particular point. Students explain the...
Curated OER
Graphing Linear Equations
In this linear equations worksheet, students graph 2 linear equations using x- and y- intercepts. Students then graph 2 additional equations using the slope and y-intercept method.
Concord Consortium
Function Project
What if a coordinate plane becomes a slope-intercept plane? What does the graph of a linear function look like? Learners explore these questions by graphing the y-intercept of a linear equation as a function of its slope. The result is a...
West Contra Costa Unified School District
Discovering Slope of a Line in Standard Form
From start to finish this skills practice resource provides a way for individuals to explore the standard form equation of a line. Begin with a warm-up, work through the problems, and then discover the relationship between the equation...
Curated OER
Profitable Soda Stand
Am I making any money? Help learners determine if their fictitious soda stand is turning a profit. They graph linear equations using the slope and y-intercept and identify the best price to use to sell soda. They identify the domain and...
Blogger
Slope Intercept Form (y=mx+b) Foldable
Each piece of the y=mx+b formula represents something important about graphing. Take those important ideas and connect them to each part of the formula with notes or examples underneath each tab representing y, m, x, and b.


