Curated OER
Graphing and the Coordinate Plane
Students examine the four quadrants of Cartesian coordinate plane. They play maze games and coordinate games to discover how to read and plot points on the plane. Students plot points on the coordinate plane and examine the ratio of...
Curated OER
Linear Equations
In this algebra worksheet, 11th graders solve linear equations and rewrite them in the form y=mx + b. They graph the equations using the slope and y-intercept. There are 22 questions with an answer key.
Curated OER
Be the Kiwi
Young scholars analyze linear equation. In this algebra lesson, students analyze and graph data. They solve problems involving linear equations and graph lines using the slope and y intercept.
Curated OER
Linear Functions
Students solve, identify and define linear equations. In this algebra lesson, students calculate the slope and y-intercept of a line. They graph the line given two points and the slope.
Curated OER
Whose Line is it Anyway?
Students solve systems of equations. In this algebra lesson, students identify the domain and range of each function. They use the slope and y-intercept to graph each line.
Curated OER
Graphing Linear Equations Using Data Tables
Students review the Cartesian plane and the process of plotting points. In groups, students create tables, identify the slope and y-intercept, and graph the equation. Afterward, students perform the same process, only, individually. As a...
Curated OER
Linear Equations Data Tables
Pupils graph linear equations on a Cartesian plane. After describing data tables and their use, students explore how the information from a table can be used to create a line graph. They discuss reasons for plotting a minimum of three...
Curated OER
Solving Systems of Linear Equations Graphically
Students solve systems of equations graphically. In this algebra lesson, students find the point of intersection of two lines if they are not parallel. They rewrite the equation in the y=mx + b form and graph using slope and intercept.
PBL Pathways
College Costs 2
What is the financial benefit for attending a community college for the first two years before transferring to a four-year college? The second part of the educational lesson asks young scholars to explore this question through data...
CK-12 Foundation
Input-Output Tables for Function Rules
How does changing a graph affect the function? Learners watch the changing input-output table as they adjust the location of the line graph. Questions prompt them to complete a table of values and determine the function rule.
Curated OER
Linear Functions
In this algebra instructional activity, students solve linear equations by identifying the slope and y-intercept of the equation. They have to rewrite some of the equations in to y= mx + b forms first. There are 4 questions with an...
Curated OER
Graphing and the Coordinate Plane
Students learn about the Cartesian coordinate plane, understand the four quadrants of the Cartesian coordinate plane, and plot points on the plane. Students read coordinates for a point from a graph and give the ratio of rise over run...
Curated OER
Graphing Linear Equations with Calculator
Students graph lines using the calculator. In this algebra lesson, students graph lines of equations in the form y=mx+b. They input equations into the TI Calculator and graph using the slope and intercept. They analyze the graph for...
Curated OER
Numerical Analysis: Introduction to Approximation Theory
In this introduction to approximation theory, students compute the slope and intercept of a line. They describe nonlinear relationships. This four page worksheet contains approximately five problems.
Curated OER
Properties of Logarithms
Students explore the concept of logarithms. For this logarithms lesson, students graph logarithms on their Ti-Nspire calculator. Students describe the shapes of their graphs by identifying slope, y-intercepts, and roots. Students...
University of North Texas
Math Exam 1 Review
Perfect as a review guide, this worksheet provides a range of questions focusing on functions. Topics include composing functions, transformations, domains, and polynomials. Also included are corresponding worksheets focusing on other...
Charleston School District
Solving Systems by Inspection
Can you solve a system by just looking at it? The previous lessons in the series taught three methods of solving systems of equations. Now learners discover they can determine the number of solutions of a system just by looking at it....
EngageNY
Equations for Lines Using Normal Segments
Describing a line using an algebraic equation is an essential skill in mathematics. The previous lesson in the series challenged learners to determine if segments are perpendicular with a formula. Now they use the formula to determine...
BW Walch
Solving Systems of Linear Equations
Solving systems of equations underpins much of advanced algebra, especially linear algebra. Developing an intuition for the kinds and descriptions of solutions is key for success in those later courses. This intuition is exactly what...
Virginia Department of Education
Linear Curve of Best Fit
Is foot length to forearm length a linear association? The class collects data of fellow scholars' foot length and the length of their forearms. They plot the data and find a line of best fit. Using that line, they make predictions of...
Alaska Department of Education
Mathematics Reference Sheet
Triangles and prisms don't stand a chance when your learners use this handout full of the formulas they need to know about the different shapes. Area, volume, and surface formulas are all covered along with the standard measurement and...
Willow Tree
Approximating a Line of Best Fit
You may be able to see patterns visually, but mathematics quantifies them. Here learners find correlation in scatterplots and write equations to represent that relationship. They fit a line to the data, find two points on the line, and...
Charleston School District
Equations of Linear Functions
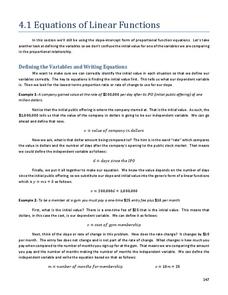
Teaching linear function relationships using contextual information is beneficial to pupils' understanding. The lesson uses problem solving to build linear functions given different information for each problem. This is the second in a...
Illustrative Mathematics
Chicken and Steak, Variation 2
Many organizations put on barbecues in order to make money. In a real-world math problem, the money allotted to purchase steak and chicken at this barbecue is only one hundred dollars. It is up to your potential chefs to figure out how...
Other popular searches
- Writing Slope Intercept Form
- Algebra Slope Intercept Form
- Write Slope Intercept Form
- Slope Intercept Formula
- Graphing Slope Intercept Form
- Slope Intercept Form Planet
- Slope and Y Intercept Formula
- Define Slope Intercept Form
- Slope Intercept Form of a Line


