Curated OER
My Test Book: Stem and Leaf Plots
In this math skills worksheet, students solve 10 multiple choice math problems regarding stem and leaf plots. Students may view the correct answers.
Curated OER
SOL Review
For this SOL worksheet, students solve inequalities, identify equivalent fractions and graph polynomial functions. They find the geometric means and compute average rates. This eight-page worksheet contains 20 multiple-choice problems.
Curated OER
Analysis Review Sheet
In this analysis review activity, students solve 3 complex inequalities, graph 2 absolute value inequalities, and write the equations for altitudes and tangent lines for 4 problems.
Virginia Department of Education
Factoring for Zeros
Relate factors to zeros and x-intercepts. Scholars first graph quadratics in both standard and factored forms to see that they are the same. They go on to use the graphs to see the relationship between factors and x-intercepts.
Curated OER
Line Plot Touchdowns
In this line plots worksheet, students read the number of touchdowns that were scored in Super Bowl Games from 1990-2000. Students use the line plots to answer the questions.
Curated OER
Linear Inequalities
In this algebra worksheet, students solve linear inequalities. They graph their solution on a coordinate plane. There are 6 questions with answer key.
Curated OER
Graphing Linear Equations
In this math instructional activity, students practice solving systems of linear equations using the elimination and substitution methods. They also graph the solutions.
Curated OER
Inequalities
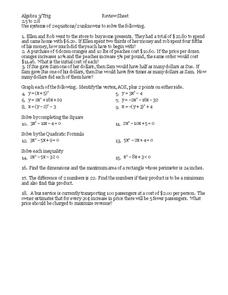
In this inequalities learning exercise, 9th graders solve and complete 18 different types of problems. First, they use systems of 2 equations/2 unknowns to solve each word problem shown. Then, students graph each and identify the vertex...
Curated OER
Solving Systems by Graphing
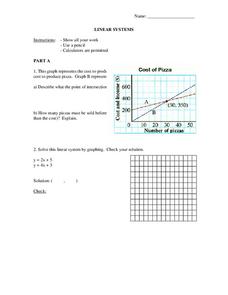
In this Algebra I/Algebra II worksheet, learners solve a system of linear equations by graphing. The one page worksheet contains one problem. Answer is provided.
Curated OER
Conics and Graphing
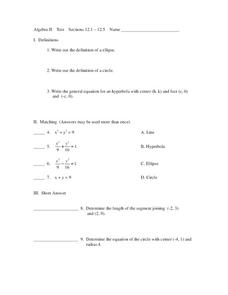
In this algebra worksheet, students solve equations by graphing an ellipse, circle and hyperbola. They match equations to graphs and define each type of function. There are 20 questions total.
Inside Mathematics
Printing Tickets
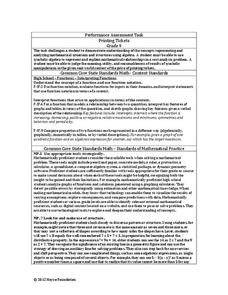
Determine the better deal. Pupils write the equation for the cost of printing tickets from different printers. They compare the costs graphically and algebraicaly to determine which printer has the best deal based upon the quantity of...
Curated OER
Final Exam Review: College Algebra
In this final exam review worksheet,s students solve systems of equations, polynomials and factor quadratic equations. They identify the slope of a line and write linear equations. Students use Cramer's rule, graphing, substitution,...
Curated OER
Academic Algebra II - 1st Semester Exam
In this solving quadratic equations worksheet, students solve 60 multiple choice and short answer problems. Students complete the square, factor, multiply, and solve quadratic equations.
Curated OER
The Konigsberg Bridge Problem
In this Konigsberg Bridge problem learning exercise, high schoolers solve 35 short answer problems. Students construct networks consisting of even and odd vertices. High schoolers make conjectures about the number of odd and even...
Curated OER
Easy Worksheet: Limits 2
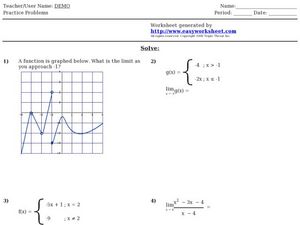
In this limits worksheet, students solve 4 short answer problems. Students identify the limit of a function for a specified value given a graph, equation, or piecewise function.
Curated OER
Further Differentiation
In this further differentiation instructional activity, students solve and complete 7 various types of problems. First, they sketch the graph of each equation using a stationary point. Then, students find the stationary points of each...
Curated OER
Exponential Functions
In this exponential functions activity, 9th graders solve and complete 23 various types of problems. First, they simplify each expression. Then, students evaluate the function at different values of x and plot the ordered pairs. in...
Curated OER
Box-and-Whisker Plots
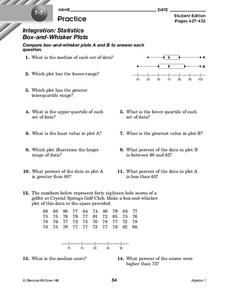
In this box-and-whisker plots worksheet, 9th graders solve and complete 14 different problems that include comparing various box-and-whisker plots. First, they determine the median for each set of data and plot the lesser range. Then,...
Curated OER
Measures of Central Tendency
For this measures of central tendency worksheet, students solve and complete 6 different problems. First, they count the number of items in each set of data. Then, students determine the mean, median and mode for each. In addition, they...
Curated OER
Evaluating Functions
In this evaluating functions worksheet, 11th graders solve and complete 24 various types of problems. First, they evaluate the functions for the given values. Then, students graph each of piecewise functions. They also write an equation...
Curated OER
Stem and Leaf Plots
In this stem and leaf plots worksheet, students solve and complete 10 different problems that include designing stem and leaf plots. First, they use the table on the left to determine the least score and the range of the total scores...
Virginia Department of Education
Road Trip
Help plan a road trip with linear equations. Scholars consider two different rental car companies and write equations representing the cost for each company. They graph the system of equations to determine the conditions under which each...
Inside Mathematics
Conference Tables
Pupils analyze a pattern of conference tables to determine the number of tables needed and the number of people that can be seated for a given size. Individuals develop general formulas for the two growing number patterns and use them to...
Curated OER
Adding and Subtracting Integers: The Symbols + and -
This activity begins with an explanation of how to add and subtract positive and negative integers. Learners solve and complete 20 different problems that include these types of problems. First, they fill in each blank with the correct...


