Curated OER
Absolute Value Inequalities
In this algebra worksheet,students solve inequality equations and graph their answers on a number line. There are 22 questions with an answer key.
Curated OER
Solving Open Sentences Involving Absolute Value
In this math worksheet, students solve 6 open sentences and graph solutions using a line graph. Students then express 2 story problems in terms of inequalities. Students then write open sentences for 2 graphs.
Curated OER
Graphing Linear Equations
Ninth graders review the information that they have already learned
with regard to linear equations and graphical representations. They then assist in combining equations with a graphical element and complete various graphs with this...
Curated OER
Solving Systems using Elimination
Using elimination to find the point of intersection of two lines, students learn to solve systems of equation. They graph their solutions and use the TI to verify the solution.
Curated OER
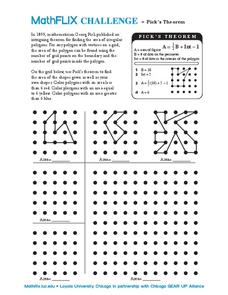
Pick's Theorem
In this Pick's Theorem worksheet, students solve and graph 6 different problems that include using Pick's Theorem to solve. First, they use Pick's Theorem to determine the area of the shapes given as well as their own shapes drawn. Then,...
Curated OER
Linear Inequalities
Ninth graders practice recognizing similarities and differences found in the graphing of inequalities and equations. Once observatioons are made they solve some of their own applying prior knowledge.
Lane Community College
Review Sheets: Beginning Algebra
This jumbo worksheet contains everything you need to get through Pre-Algebra. Begin with simple expressions, and end with linear functions and polygons. There are multiple problems for each topic to make sure those skills are set.
Curated OER
System of Two Quadratic Inequalities
Pupils set up and solve a system of quadratic inequalities related to real-world situations.
Curated OER
Rational Function Graphs
Students use algebraic methods to represent and solve problems. Using a graphing calculator, students solve rational and inequality problems. They visually demonstrate solutions of functions through graphing. Students answer questions...
Curated OER
FCAT Real World Solving Linear Equations/Systems
Pupils relate real life situation to the equations, graphs and inequalities. They model real life scenarios using matrices and draw conclusions from their data. This lesson plan is aligned with FCAT.
Inside Mathematics
Population
Population density, it is not all that it is plotted to be. Pupils analyze a scatter plot of population versus area for some of the states in the US. The class members respond to eight questions about the graph, specific points and...
Kenan Fellows
Density
Most scholars associate density with floating, but how do scientists determine the exact density of an unknown liquid? The third lesson in a seven-part series challenges scholars to find the mass and volume of two unknown liquids. Each...
Shodor Education Foundation
InteGreat
Hands-on investigation of Riemann sums becomes possible without intensive arithmetic gymnastics with this interactive lesson plan. Learners manipulate online graphing tools to develop and test theories about right, left, and midpoint...
Curated OER
Linear Programming
In this algebra instructional activity, students calculate the maximum and minimum of a shaded region. They identify the boundaries and their vertices's. There are 2 problems.
Wisconsin Online Resource Center
Oversized Inch
Each member of the class creates their own paper ruler. Using their ruler, kids walk around the room measuring the objects you've specified. Discuss how items should be measured to the 16th of an inch, the smallest unit on their ruler....
Los Angeles County Office of Education
Assessment for the California Mathematics Standards Grade 2
Test scholars mathematic skills with an assessment addressing addition, subtraction, multiplication, place value, measurement, geometric shapes, expanded notation; and their ability to compare numbers, write number sentences, draw...
American Statistical Association
Scatter It! (Predict Billy’s Height)
How do doctors predict a child's future height? Scholars use one case study to determine the height of a child two years into the future. They graph the given data, determine the line of best fit, and use that to estimate the height in...
Flipped Math
Unit 3 Review: Systems of Equations
More practice makes perfect. A review packet helps pupils remind themselves of the content of the unit. They determine whether points are solutions to linear equations, graph systems of equations and inequalities, and solve systems of...
Kenan Fellows
Solutions
Scientists require specific chemical solutions for their experiments. In the seventh and final installment in a series that integrates chemistry and algebra II, scholars learn to set up a system of equations to solve the volume of a...
Kenan Fellows
Isotopic Pennies
Many people confuse atomic mass and atomic numbers. The sixth of seven lessons in a unit requires scholars to find the weight of different groups of pennies. Then, they must solve how many of each type of penny exists in a closed system...
Concord Consortium
Gestation and Longevity
Is the gestation length of an animal a predictor of the average life expectancy of that animal? Learners analyze similar data for more than 50 different animals. They choose a data display and draw conclusions from their graphs.
Curated OER
Study Guide: Rational Numbers
In this rational numbers worksheet, students solve and complete 8 different problems that include applying the comparison property and density property for rational numbers. First, they replace each blank with the correct symbol to make...
Curated OER
Inequalities
Seventh graders graph solutions for inequalities on a number line. They solve 1 and 2 step inequalities in one variable. Students also check solutions to 1 and 2 step equations in one variable
Curated OER
Inequalities lesson 4
Seventh graders graph solutions for inequalities on a number line. They solve problems combining like terms inequalities in one variable. Students check solutions to combining like terms inequalities in one variable.


