Curated OER
Equations and Inequalities
In this equations and inequalities worksheet, 9th graders solve and complete 2 multiple choice problems. First, they read and identify the graph shown representing a given equation. Then, students determine the graph that best represents...
Curated OER
Balanced Or Unbalanced
Students use physical models and graphs in order to solve problems that have their origin in the real world that require algebraic thinking. The words are changed into equations and inequalities in order to be solved. This requires...
Curated OER
Linear Inequality
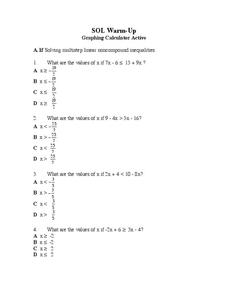
Seventh graders solve and complete 12 different problems that include graphing and using multi-steps to solve. First, they solve each multi-step linear non-compound inequality with the given values. Then, pupils graph each solution given...
Virginia Department of Education
Spring Fling Carnival
Think critically — and linearly by applying linear equations to solve real-world problems. Young mathematicians write equations to model the profit on popcorn and cotton candy at a carnival and solve problems using these equations.
Curated OER
Data Analysis
In this data analysis worksheet, learners solve and complete 6 different problems that include using various types of data analysis. First, they create a stem-and-leaf plot of the ratios shown at the top and determine the mean, median,...
Curriculum Corner
7th Grade Math "I Can" Statement Posters
Translate the Common Core math standards into a series of achievable "I can" statements with this collection of classroom displays. Offering posters for each standard, this resource is a great way to support your seventh graders as...
Oddrobo Software
King of Math Junior
Do your students have what it takes to be the king of math? Find out with this fun skills practice game that covers a wide range of topics from counting and basic operations to measurement and fractions.
Curated OER
Solving the Puzzle
Students create a map showing the United States borders at a specific period in history and produce three questions to be answered by examining the map. They also write a productive paragraph explaining who, what, when, where, how/why a...
Curated OER
Graphing Linear Inequalities
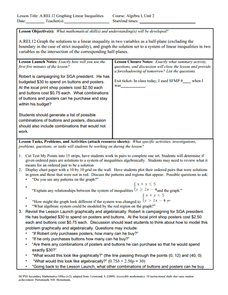
Eighth graders extend skills for representing and solving linear equations to linear inequalities. Lesson activities build understanding and skill by plotting ordered pairs of numbers that either satisfy or do not satisfy a given...
Curated OER
Mr. Brown's Pet Store
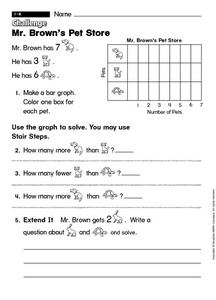
In this early childhood problem solving worksheet, students make a bar graph with the provided information and then use the graph to solve 4 problems.
Curated OER
Two Variable Inequalities
In this algebra worksheet, students solve inequalities using addition, subtractions and multiplication. They graph the inequalities with shading. There are 2 questions.
Curated OER
Linear Programming and the Inequalz App
Learners graph system of linear inequalities in this lesson. Your class will use the Inequality Graphing App to enter linear programming functions into the calculator that can be stored for later use. They then determine the maximum for...
Curated OER
Integrated Algebra: State Exam
In this integrated algebra worksheet, students solve problems related to topics covered in algebra for the entire year. Topics include, but are not limited to, inequalities, probability, functions, interval notation, exploring...
Curated OER
Integrated Algebra Final Exam
In this integrated algebra worksheet, students solve problems involving system of equations, quadratic equations, inequalities, surface area, and radicals. This 28-page worksheet contains 39 multi-step problems.
Curated OER
Pounds of Paper
In this collecting of data worksheet, 2nd graders study and analyze a pounds of paper table in order to solve and answer 6 mathematical questions.
Curated OER
Frequency Tables and Histograms
In this graph worksheet, 5th graders study the data presented on a bar graph. Students then respond to 4 short answer questions using the information that has been provided.
Curated OER
My Test Book: Stem and Leaf Plots
In this math skills worksheet, students solve 10 multiple choice math problems regarding stem and leaf plots. Students may view the correct answers.
Curated OER
SOL Review
In this SOL worksheet, students solve inequalities, identify equivalent fractions and graph polynomial functions. They find the geometric means and compute average rates. This eight-page worksheet contains 20 multiple-choice...
Curated OER
Characteristics of Exponential Functions
What can an upper grader do with an exponential function? They can solve and graph it, identify its important characteristic, and differentiate graphs based on shifts in graph bases that are greater or less than one. This 45 minute...
Curated OER
Analysis Review Sheet
For this analysis review worksheet, students solve 3 complex inequalities, graph 2 absolute value inequalities, and write the equations for altitudes and tangent lines for 4 problems.
Curated OER
Absolute Value Equations and Inequalities
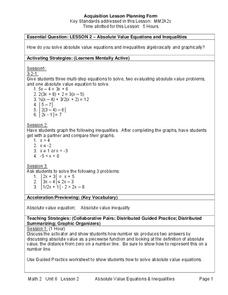
Students explore the concept of absolute value inequalities and equations. In this absolute value inequalities and equations lesson, students discuss how to solve absolute value inequalities and equations through teacher led discussion...
Curated OER
Linear and Exponential Functions
This comprehensive unit on linear and exponential functions provides numerous clearly-written worksheets. Topics include graphing linear equations, solving systems of equations algebraically and by graphing, identifying the domain and...
Florida Center for Instructional Technology
A Human Number Line: Teacher Notes
Twenty-one pieces of tagboard can lead your class to a greater understanding of integers when you use them to form a human number line. After creating this math tool, two strategies for adding and subtracting will have your...
Virginia Department of Education
Factoring for Zeros
Relate factors to zeros and x-intercepts. Scholars first graph quadratics in both standard and factored forms to see that they are the same. They go on to use the graphs to see the relationship between factors and x-intercepts.


